Panamanian vs Immigrants from Caribbean Child Poverty Under the Age of 16
COMPARE
Panamanian
Immigrants from Caribbean
Child Poverty Under the Age of 16
Child Poverty Under the Age of 16 Comparison
Panamanians
Immigrants from Caribbean
17.5%
CHILD POVERTY UNDER THE AGE OF 16
6.9/ 100
METRIC RATING
209th/ 347
METRIC RANK
20.8%
CHILD POVERTY UNDER THE AGE OF 16
0.0/ 100
METRIC RATING
296th/ 347
METRIC RANK
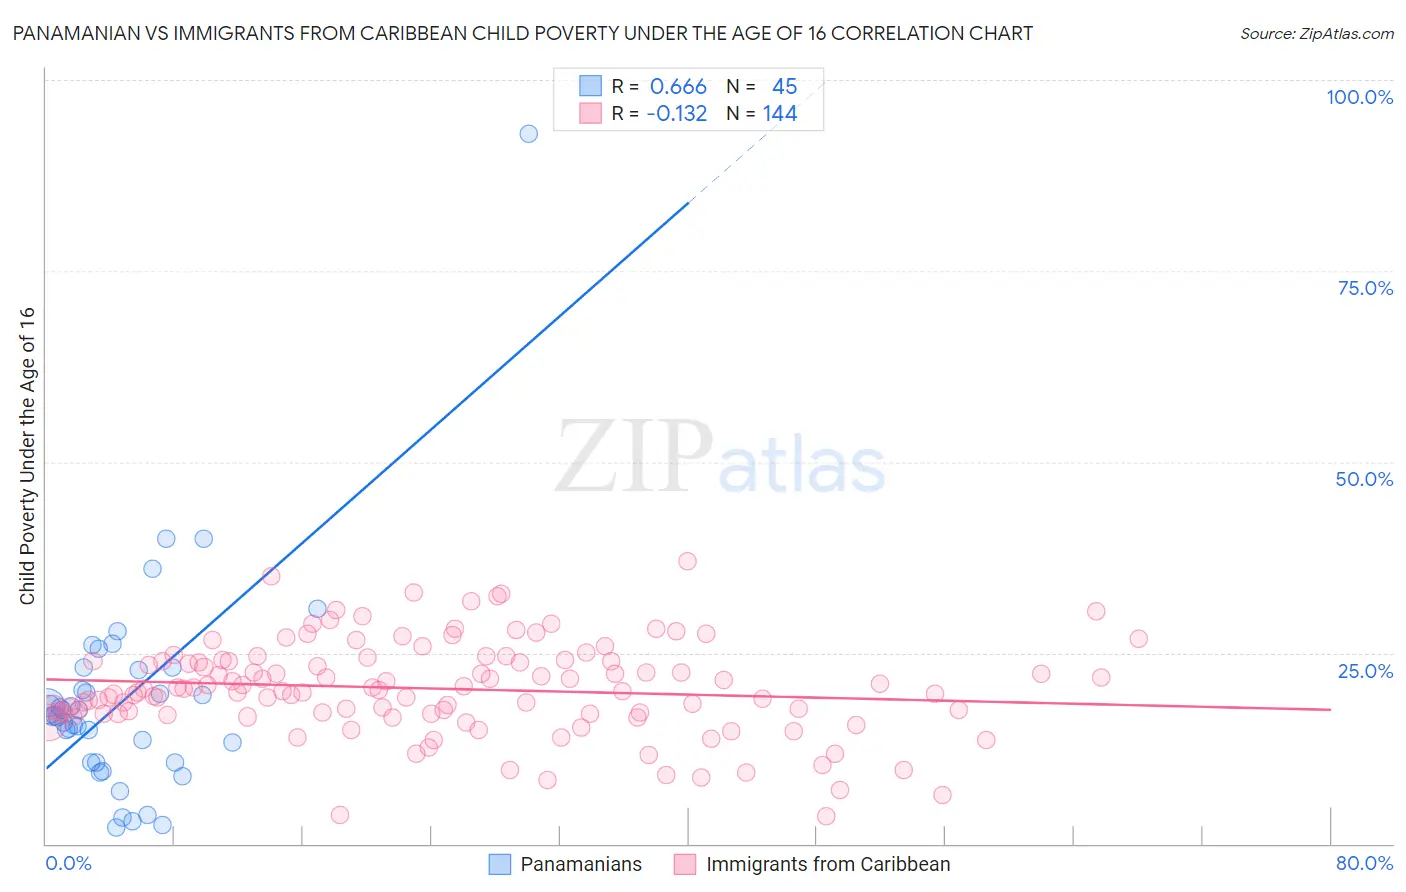
Panamanian vs Immigrants from Caribbean Child Poverty Under the Age of 16 Correlation Chart
The statistical analysis conducted on geographies consisting of 280,029,681 people shows a significant positive correlation between the proportion of Panamanians and poverty level among children under the age of 16 in the United States with a correlation coefficient (R) of 0.666 and weighted average of 17.5%. Similarly, the statistical analysis conducted on geographies consisting of 444,986,606 people shows a poor negative correlation between the proportion of Immigrants from Caribbean and poverty level among children under the age of 16 in the United States with a correlation coefficient (R) of -0.132 and weighted average of 20.8%, a difference of 18.9%.
Child Poverty Under the Age of 16 Correlation Summary
| Measurement | Panamanian | Immigrants from Caribbean |
| Minimum | 2.1% | 3.6% |
| Maximum | 93.0% | 37.0% |
| Range | 90.9% | 33.4% |
| Mean | 18.9% | 20.3% |
| Median | 16.8% | 20.1% |
| Interquartile 25% (IQ1) | 10.7% | 17.0% |
| Interquartile 75% (IQ3) | 22.9% | 24.0% |
| Interquartile Range (IQR) | 12.2% | 6.9% |
| Standard Deviation (Sample) | 14.4% | 6.1% |
| Standard Deviation (Population) | 14.3% | 6.1% |
Similar Demographics by Child Poverty Under the Age of 16
Demographics Similar to Panamanians by Child Poverty Under the Age of 16
In terms of child poverty under the age of 16, the demographic groups most similar to Panamanians are Alaskan Athabascan (17.5%, a difference of 0.010%), Immigrants from Thailand (17.5%, a difference of 0.14%), Immigrants (17.5%, a difference of 0.16%), Pennsylvania German (17.4%, a difference of 0.25%), and Immigrants from the Azores (17.5%, a difference of 0.33%).
| Demographics | Rating | Rank | Child Poverty Under the Age of 16 |
| Ugandans | 14.3 /100 | #202 | Poor 17.1% |
| Immigrants | Sierra Leone | 14.2 /100 | #203 | Poor 17.1% |
| Hmong | 14.0 /100 | #204 | Poor 17.1% |
| Aleuts | 13.9 /100 | #205 | Poor 17.1% |
| Alaska Natives | 11.8 /100 | #206 | Poor 17.2% |
| German Russians | 8.6 /100 | #207 | Tragic 17.4% |
| Pennsylvania Germans | 7.5 /100 | #208 | Tragic 17.4% |
| Panamanians | 6.9 /100 | #209 | Tragic 17.5% |
| Alaskan Athabascans | 6.9 /100 | #210 | Tragic 17.5% |
| Immigrants | Thailand | 6.6 /100 | #211 | Tragic 17.5% |
| Immigrants | Immigrants | 6.5 /100 | #212 | Tragic 17.5% |
| Immigrants | Azores | 6.2 /100 | #213 | Tragic 17.5% |
| Iraqis | 5.9 /100 | #214 | Tragic 17.5% |
| Malaysians | 5.9 /100 | #215 | Tragic 17.5% |
| Sierra Leoneans | 5.7 /100 | #216 | Tragic 17.6% |
Demographics Similar to Immigrants from Caribbean by Child Poverty Under the Age of 16
In terms of child poverty under the age of 16, the demographic groups most similar to Immigrants from Caribbean are Hispanic or Latino (20.8%, a difference of 0.13%), Arapaho (20.8%, a difference of 0.13%), Mexican (20.7%, a difference of 0.38%), Immigrants from Haiti (20.9%, a difference of 0.43%), and Haitian (20.7%, a difference of 0.52%).
| Demographics | Rating | Rank | Child Poverty Under the Age of 16 |
| Senegalese | 0.0 /100 | #289 | Tragic 20.4% |
| Yaqui | 0.0 /100 | #290 | Tragic 20.4% |
| Chippewa | 0.0 /100 | #291 | Tragic 20.5% |
| Immigrants | Latin America | 0.0 /100 | #292 | Tragic 20.5% |
| Immigrants | Senegal | 0.0 /100 | #293 | Tragic 20.6% |
| Haitians | 0.0 /100 | #294 | Tragic 20.7% |
| Mexicans | 0.0 /100 | #295 | Tragic 20.7% |
| Immigrants | Caribbean | 0.0 /100 | #296 | Tragic 20.8% |
| Hispanics or Latinos | 0.0 /100 | #297 | Tragic 20.8% |
| Arapaho | 0.0 /100 | #298 | Tragic 20.8% |
| Immigrants | Haiti | 0.0 /100 | #299 | Tragic 20.9% |
| Indonesians | 0.0 /100 | #300 | Tragic 21.0% |
| Immigrants | Grenada | 0.0 /100 | #301 | Tragic 21.0% |
| Immigrants | Bahamas | 0.0 /100 | #302 | Tragic 21.0% |
| Choctaw | 0.0 /100 | #303 | Tragic 21.0% |