Panamanian vs Immigrants from Peru Child Poverty Under the Age of 16
COMPARE
Panamanian
Immigrants from Peru
Child Poverty Under the Age of 16
Child Poverty Under the Age of 16 Comparison
Panamanians
Immigrants from Peru
17.5%
CHILD POVERTY UNDER THE AGE OF 16
6.9/ 100
METRIC RATING
209th/ 347
METRIC RANK
15.5%
CHILD POVERTY UNDER THE AGE OF 16
81.7/ 100
METRIC RATING
145th/ 347
METRIC RANK
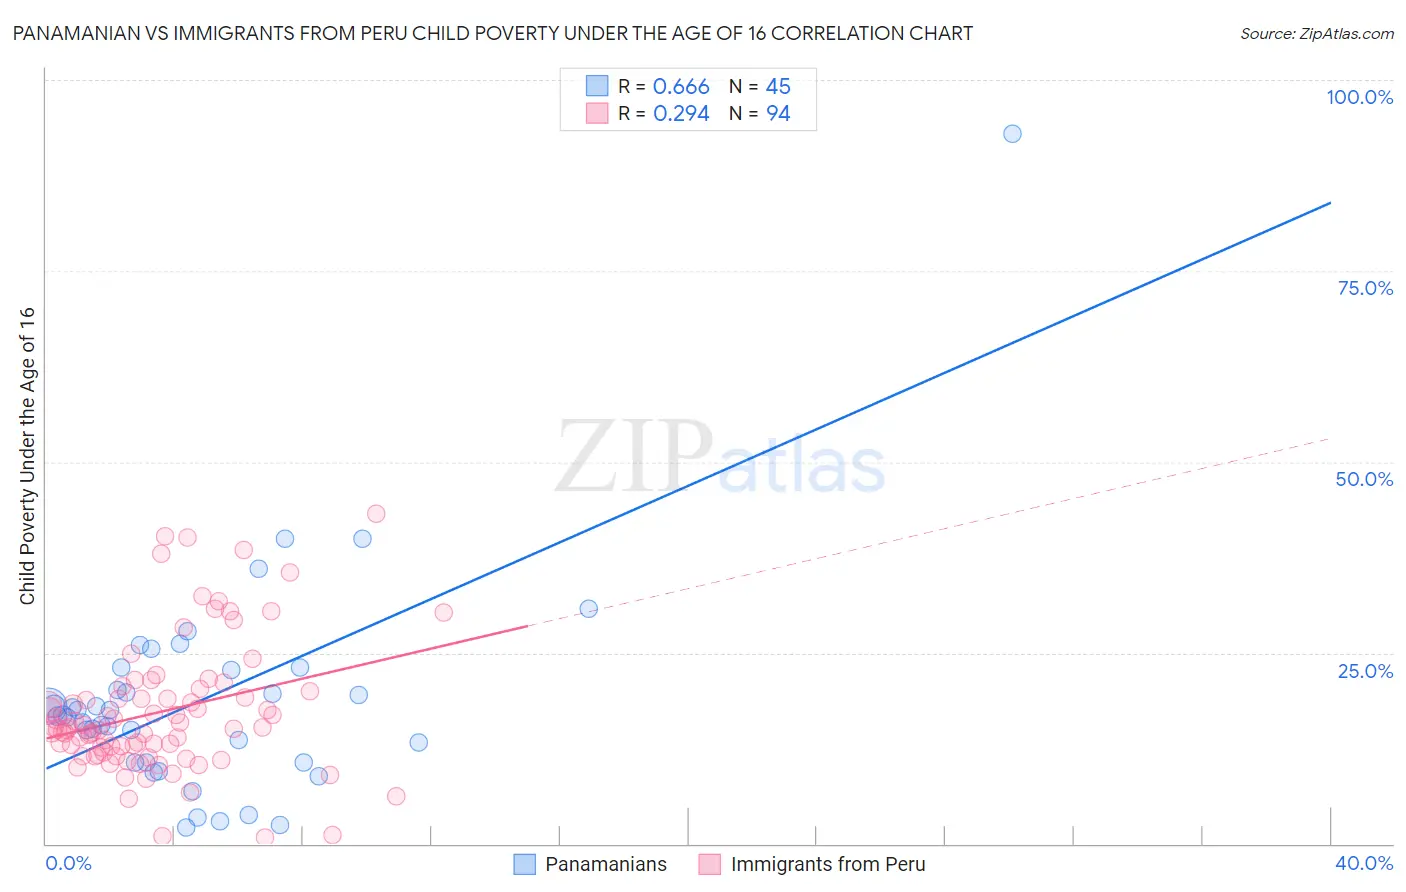
Panamanian vs Immigrants from Peru Child Poverty Under the Age of 16 Correlation Chart
The statistical analysis conducted on geographies consisting of 280,029,681 people shows a significant positive correlation between the proportion of Panamanians and poverty level among children under the age of 16 in the United States with a correlation coefficient (R) of 0.666 and weighted average of 17.5%. Similarly, the statistical analysis conducted on geographies consisting of 326,777,909 people shows a weak positive correlation between the proportion of Immigrants from Peru and poverty level among children under the age of 16 in the United States with a correlation coefficient (R) of 0.294 and weighted average of 15.5%, a difference of 12.9%.
Child Poverty Under the Age of 16 Correlation Summary
| Measurement | Panamanian | Immigrants from Peru |
| Minimum | 2.1% | 0.80% |
| Maximum | 93.0% | 43.1% |
| Range | 90.9% | 42.3% |
| Mean | 18.9% | 17.3% |
| Median | 16.8% | 15.1% |
| Interquartile 25% (IQ1) | 10.7% | 12.0% |
| Interquartile 75% (IQ3) | 22.9% | 20.0% |
| Interquartile Range (IQR) | 12.2% | 8.0% |
| Standard Deviation (Sample) | 14.4% | 8.6% |
| Standard Deviation (Population) | 14.3% | 8.6% |
Similar Demographics by Child Poverty Under the Age of 16
Demographics Similar to Panamanians by Child Poverty Under the Age of 16
In terms of child poverty under the age of 16, the demographic groups most similar to Panamanians are Alaskan Athabascan (17.5%, a difference of 0.010%), Immigrants from Thailand (17.5%, a difference of 0.14%), Immigrants (17.5%, a difference of 0.16%), Pennsylvania German (17.4%, a difference of 0.25%), and Immigrants from the Azores (17.5%, a difference of 0.33%).
| Demographics | Rating | Rank | Child Poverty Under the Age of 16 |
| Ugandans | 14.3 /100 | #202 | Poor 17.1% |
| Immigrants | Sierra Leone | 14.2 /100 | #203 | Poor 17.1% |
| Hmong | 14.0 /100 | #204 | Poor 17.1% |
| Aleuts | 13.9 /100 | #205 | Poor 17.1% |
| Alaska Natives | 11.8 /100 | #206 | Poor 17.2% |
| German Russians | 8.6 /100 | #207 | Tragic 17.4% |
| Pennsylvania Germans | 7.5 /100 | #208 | Tragic 17.4% |
| Panamanians | 6.9 /100 | #209 | Tragic 17.5% |
| Alaskan Athabascans | 6.9 /100 | #210 | Tragic 17.5% |
| Immigrants | Thailand | 6.6 /100 | #211 | Tragic 17.5% |
| Immigrants | Immigrants | 6.5 /100 | #212 | Tragic 17.5% |
| Immigrants | Azores | 6.2 /100 | #213 | Tragic 17.5% |
| Iraqis | 5.9 /100 | #214 | Tragic 17.5% |
| Malaysians | 5.9 /100 | #215 | Tragic 17.5% |
| Sierra Leoneans | 5.7 /100 | #216 | Tragic 17.6% |
Demographics Similar to Immigrants from Peru by Child Poverty Under the Age of 16
In terms of child poverty under the age of 16, the demographic groups most similar to Immigrants from Peru are Slovak (15.5%, a difference of 0.040%), Immigrants from Hungary (15.5%, a difference of 0.050%), Icelander (15.4%, a difference of 0.17%), Brazilian (15.4%, a difference of 0.24%), and Immigrants from Kuwait (15.5%, a difference of 0.24%).
| Demographics | Rating | Rank | Child Poverty Under the Age of 16 |
| Welsh | 87.2 /100 | #138 | Excellent 15.3% |
| Immigrants | Vietnam | 87.1 /100 | #139 | Excellent 15.3% |
| New Zealanders | 86.9 /100 | #140 | Excellent 15.3% |
| Slavs | 84.2 /100 | #141 | Excellent 15.4% |
| Brazilians | 82.8 /100 | #142 | Excellent 15.4% |
| Icelanders | 82.5 /100 | #143 | Excellent 15.4% |
| Immigrants | Hungary | 81.9 /100 | #144 | Excellent 15.5% |
| Immigrants | Peru | 81.7 /100 | #145 | Excellent 15.5% |
| Slovaks | 81.4 /100 | #146 | Excellent 15.5% |
| Immigrants | Kuwait | 80.5 /100 | #147 | Excellent 15.5% |
| Puget Sound Salish | 80.3 /100 | #148 | Excellent 15.5% |
| Israelis | 80.1 /100 | #149 | Excellent 15.5% |
| Immigrants | Jordan | 78.5 /100 | #150 | Good 15.6% |
| French | 78.5 /100 | #151 | Good 15.6% |
| French Canadians | 78.2 /100 | #152 | Good 15.6% |