Maltese vs Cambodian Female Poverty Among 25-34 Year Olds
COMPARE
Maltese
Cambodian
Female Poverty Among 25-34 Year Olds
Female Poverty Among 25-34 Year Olds Comparison
Maltese
Cambodians
11.4%
FEMALE POVERTY AMONG 25-34 YEAR OLDS
99.9/ 100
METRIC RATING
24th/ 347
METRIC RANK
11.7%
FEMALE POVERTY AMONG 25-34 YEAR OLDS
99.9/ 100
METRIC RATING
35th/ 347
METRIC RANK
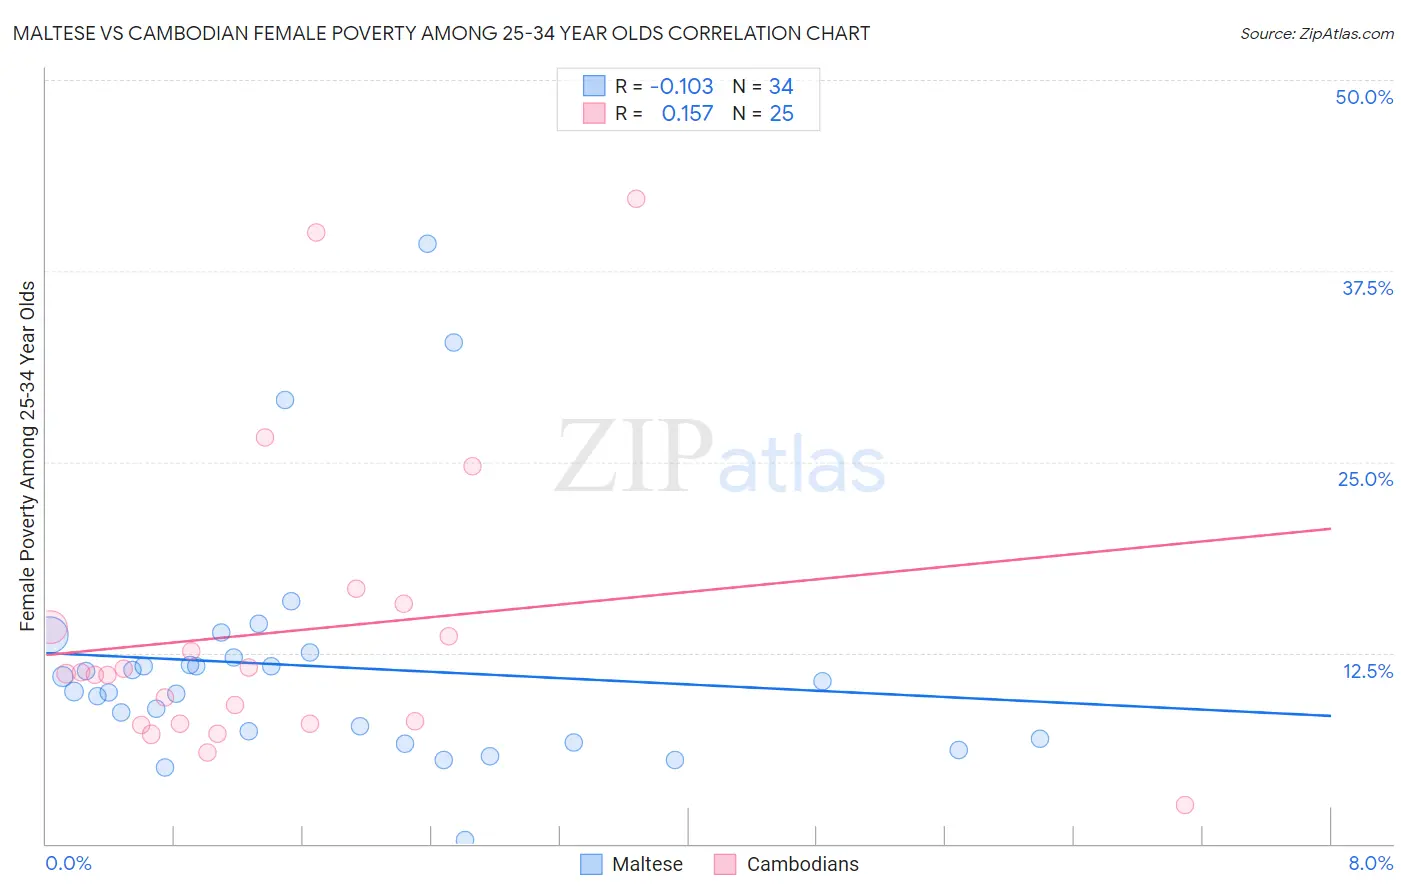
Maltese vs Cambodian Female Poverty Among 25-34 Year Olds Correlation Chart
The statistical analysis conducted on geographies consisting of 125,160,248 people shows a poor negative correlation between the proportion of Maltese and poverty level among females between the ages 25 and 34 in the United States with a correlation coefficient (R) of -0.103 and weighted average of 11.4%. Similarly, the statistical analysis conducted on geographies consisting of 102,197,555 people shows a poor positive correlation between the proportion of Cambodians and poverty level among females between the ages 25 and 34 in the United States with a correlation coefficient (R) of 0.157 and weighted average of 11.7%, a difference of 2.4%.
Female Poverty Among 25-34 Year Olds Correlation Summary
| Measurement | Maltese | Cambodian |
| Minimum | 0.28% | 2.5% |
| Maximum | 39.3% | 42.2% |
| Range | 39.0% | 39.7% |
| Mean | 11.6% | 13.9% |
| Median | 10.3% | 11.1% |
| Interquartile 25% (IQ1) | 6.9% | 7.9% |
| Interquartile 75% (IQ3) | 12.2% | 14.9% |
| Interquartile Range (IQR) | 5.3% | 7.0% |
| Standard Deviation (Sample) | 7.8% | 9.8% |
| Standard Deviation (Population) | 7.7% | 9.6% |
Demographics Similar to Maltese and Cambodians by Female Poverty Among 25-34 Year Olds
In terms of female poverty among 25-34 year olds, the demographic groups most similar to Maltese are Bolivian (11.4%, a difference of 0.030%), Asian (11.4%, a difference of 0.090%), Bhutanese (11.4%, a difference of 0.22%), Turkish (11.4%, a difference of 0.24%), and Tongan (11.5%, a difference of 0.37%). Similarly, the demographic groups most similar to Cambodians are Zimbabwean (11.7%, a difference of 0.27%), Immigrants from Poland (11.6%, a difference of 0.49%), Immigrants from Sri Lanka (11.8%, a difference of 0.49%), Taiwanese (11.8%, a difference of 0.65%), and Immigrants from North Macedonia (11.8%, a difference of 0.72%).
| Demographics | Rating | Rank | Female Poverty Among 25-34 Year Olds |
| Iranians | 100.0 /100 | #19 | Exceptional 11.2% |
| Okinawans | 100.0 /100 | #20 | Exceptional 11.3% |
| Turks | 100.0 /100 | #21 | Exceptional 11.4% |
| Asians | 99.9 /100 | #22 | Exceptional 11.4% |
| Bolivians | 99.9 /100 | #23 | Exceptional 11.4% |
| Maltese | 99.9 /100 | #24 | Exceptional 11.4% |
| Bhutanese | 99.9 /100 | #25 | Exceptional 11.4% |
| Tongans | 99.9 /100 | #26 | Exceptional 11.5% |
| Immigrants | Greece | 99.9 /100 | #27 | Exceptional 11.5% |
| Immigrants | Pakistan | 99.9 /100 | #28 | Exceptional 11.5% |
| Bulgarians | 99.9 /100 | #29 | Exceptional 11.5% |
| Cypriots | 99.9 /100 | #30 | Exceptional 11.5% |
| Immigrants | Japan | 99.9 /100 | #31 | Exceptional 11.6% |
| Immigrants | Asia | 99.9 /100 | #32 | Exceptional 11.6% |
| Immigrants | Poland | 99.9 /100 | #33 | Exceptional 11.6% |
| Zimbabweans | 99.9 /100 | #34 | Exceptional 11.7% |
| Cambodians | 99.9 /100 | #35 | Exceptional 11.7% |
| Immigrants | Sri Lanka | 99.8 /100 | #36 | Exceptional 11.8% |
| Taiwanese | 99.8 /100 | #37 | Exceptional 11.8% |
| Immigrants | North Macedonia | 99.8 /100 | #38 | Exceptional 11.8% |
| Latvians | 99.8 /100 | #39 | Exceptional 11.8% |