Panamanian vs Hispanic or Latino Female Poverty Among 25-34 Year Olds
COMPARE
Panamanian
Hispanic or Latino
Female Poverty Among 25-34 Year Olds
Female Poverty Among 25-34 Year Olds Comparison
Panamanians
Hispanics or Latinos
14.2%
FEMALE POVERTY AMONG 25-34 YEAR OLDS
8.6/ 100
METRIC RATING
210th/ 347
METRIC RANK
16.6%
FEMALE POVERTY AMONG 25-34 YEAR OLDS
0.0/ 100
METRIC RATING
296th/ 347
METRIC RANK
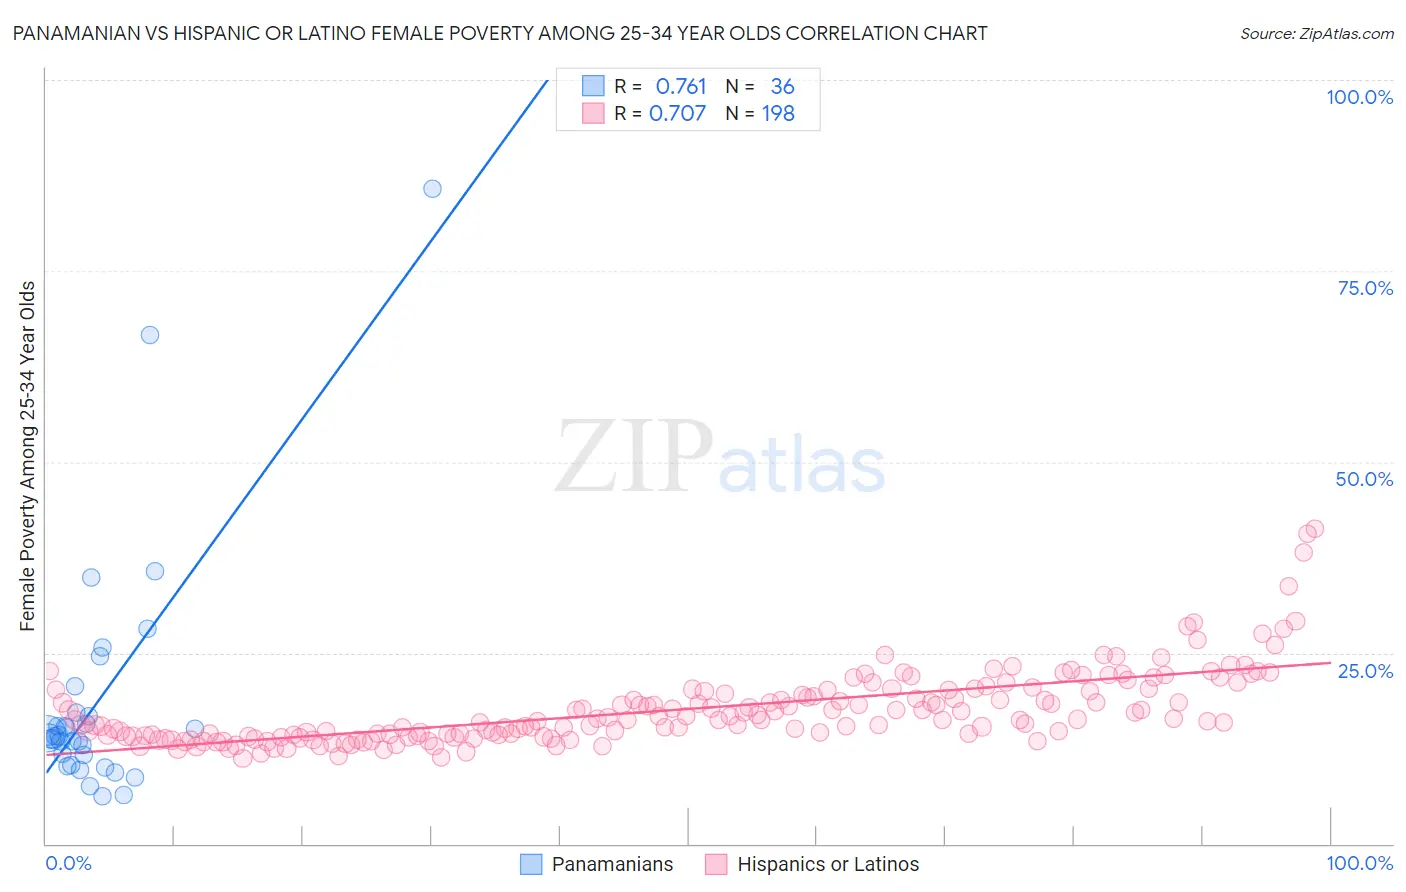
Panamanian vs Hispanic or Latino Female Poverty Among 25-34 Year Olds Correlation Chart
The statistical analysis conducted on geographies consisting of 279,201,773 people shows a strong positive correlation between the proportion of Panamanians and poverty level among females between the ages 25 and 34 in the United States with a correlation coefficient (R) of 0.761 and weighted average of 14.2%. Similarly, the statistical analysis conducted on geographies consisting of 552,620,217 people shows a strong positive correlation between the proportion of Hispanics or Latinos and poverty level among females between the ages 25 and 34 in the United States with a correlation coefficient (R) of 0.707 and weighted average of 16.6%, a difference of 17.1%.
Female Poverty Among 25-34 Year Olds Correlation Summary
| Measurement | Panamanian | Hispanic or Latino |
| Minimum | 6.2% | 11.2% |
| Maximum | 85.7% | 41.3% |
| Range | 79.5% | 30.1% |
| Mean | 18.7% | 17.6% |
| Median | 14.1% | 16.2% |
| Interquartile 25% (IQ1) | 11.0% | 14.2% |
| Interquartile 75% (IQ3) | 16.9% | 19.9% |
| Interquartile Range (IQR) | 5.9% | 5.8% |
| Standard Deviation (Sample) | 15.9% | 4.9% |
| Standard Deviation (Population) | 15.7% | 4.9% |
Similar Demographics by Female Poverty Among 25-34 Year Olds
Demographics Similar to Panamanians by Female Poverty Among 25-34 Year Olds
In terms of female poverty among 25-34 year olds, the demographic groups most similar to Panamanians are Guyanese (14.2%, a difference of 0.010%), Trinidadian and Tobagonian (14.2%, a difference of 0.12%), Immigrants from Guyana (14.3%, a difference of 0.57%), Puget Sound Salish (14.3%, a difference of 0.59%), and Immigrants from Panama (14.1%, a difference of 0.66%).
| Demographics | Rating | Rank | Female Poverty Among 25-34 Year Olds |
| Immigrants | Immigrants | 14.5 /100 | #203 | Poor 14.0% |
| Hawaiians | 13.6 /100 | #204 | Poor 14.1% |
| Immigrants | Africa | 13.4 /100 | #205 | Poor 14.1% |
| Hungarians | 11.8 /100 | #206 | Poor 14.1% |
| Japanese | 11.7 /100 | #207 | Poor 14.1% |
| Immigrants | Panama | 11.6 /100 | #208 | Poor 14.1% |
| Guyanese | 8.6 /100 | #209 | Tragic 14.2% |
| Panamanians | 8.6 /100 | #210 | Tragic 14.2% |
| Trinidadians and Tobagonians | 8.2 /100 | #211 | Tragic 14.2% |
| Immigrants | Guyana | 6.6 /100 | #212 | Tragic 14.3% |
| Puget Sound Salish | 6.5 /100 | #213 | Tragic 14.3% |
| French | 6.2 /100 | #214 | Tragic 14.3% |
| Immigrants | Nigeria | 6.2 /100 | #215 | Tragic 14.3% |
| French Canadians | 5.5 /100 | #216 | Tragic 14.3% |
| Spanish American Indians | 5.5 /100 | #217 | Tragic 14.3% |
Demographics Similar to Hispanics or Latinos by Female Poverty Among 25-34 Year Olds
In terms of female poverty among 25-34 year olds, the demographic groups most similar to Hispanics or Latinos are Immigrants from Guatemala (16.6%, a difference of 0.060%), Mexican (16.6%, a difference of 0.20%), Immigrants from Central America (16.6%, a difference of 0.27%), Blackfeet (16.7%, a difference of 0.57%), and Spanish American (16.7%, a difference of 0.61%).
| Demographics | Rating | Rank | Female Poverty Among 25-34 Year Olds |
| Osage | 0.0 /100 | #289 | Tragic 16.4% |
| Indonesians | 0.0 /100 | #290 | Tragic 16.4% |
| Comanche | 0.0 /100 | #291 | Tragic 16.5% |
| Immigrants | Dominica | 0.0 /100 | #292 | Tragic 16.5% |
| Potawatomi | 0.0 /100 | #293 | Tragic 16.5% |
| Immigrants | Central America | 0.0 /100 | #294 | Tragic 16.6% |
| Mexicans | 0.0 /100 | #295 | Tragic 16.6% |
| Hispanics or Latinos | 0.0 /100 | #296 | Tragic 16.6% |
| Immigrants | Guatemala | 0.0 /100 | #297 | Tragic 16.6% |
| Blackfeet | 0.0 /100 | #298 | Tragic 16.7% |
| Spanish Americans | 0.0 /100 | #299 | Tragic 16.7% |
| U.S. Virgin Islanders | 0.0 /100 | #300 | Tragic 16.7% |
| Immigrants | Congo | 0.0 /100 | #301 | Tragic 16.7% |
| Alaska Natives | 0.0 /100 | #302 | Tragic 16.8% |
| Immigrants | Mexico | 0.0 /100 | #303 | Tragic 16.8% |