Palestinian vs Immigrants from Bolivia Child Poverty Under the Age of 5
COMPARE
Palestinian
Immigrants from Bolivia
Child Poverty Under the Age of 5
Child Poverty Under the Age of 5 Comparison
Palestinians
Immigrants from Bolivia
15.8%
CHILD POVERTY UNDER THE AGE OF 5
95.9/ 100
METRIC RATING
99th/ 347
METRIC RANK
13.8%
CHILD POVERTY UNDER THE AGE OF 5
100.0/ 100
METRIC RATING
22nd/ 347
METRIC RANK
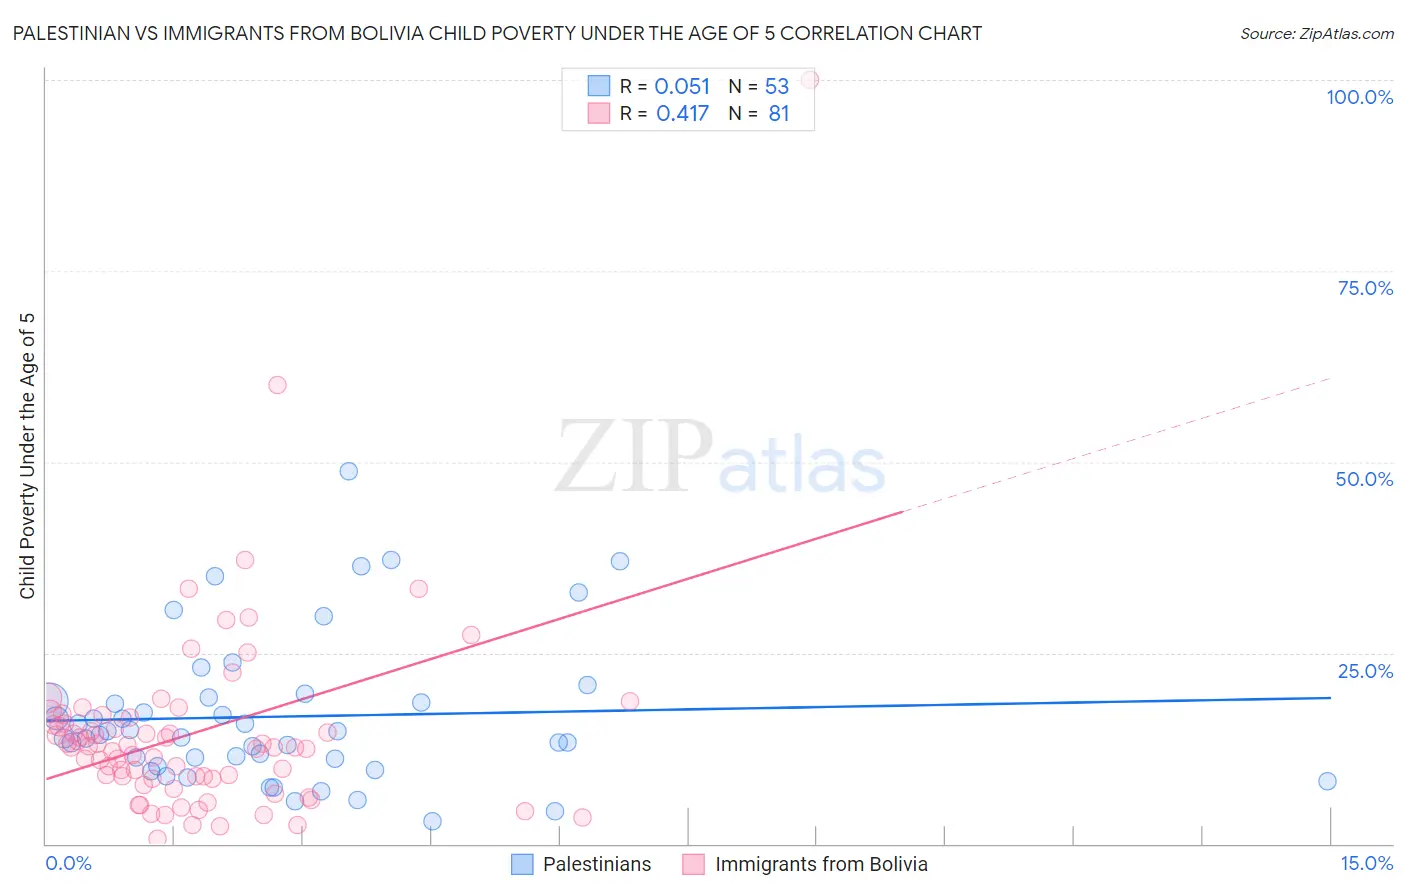
Palestinian vs Immigrants from Bolivia Child Poverty Under the Age of 5 Correlation Chart
The statistical analysis conducted on geographies consisting of 211,703,351 people shows a slight positive correlation between the proportion of Palestinians and poverty level among children under the age of 5 in the United States with a correlation coefficient (R) of 0.051 and weighted average of 15.8%. Similarly, the statistical analysis conducted on geographies consisting of 155,762,885 people shows a moderate positive correlation between the proportion of Immigrants from Bolivia and poverty level among children under the age of 5 in the United States with a correlation coefficient (R) of 0.417 and weighted average of 13.8%, a difference of 14.4%.
Child Poverty Under the Age of 5 Correlation Summary
| Measurement | Palestinian | Immigrants from Bolivia |
| Minimum | 2.9% | 0.59% |
| Maximum | 48.8% | 100.0% |
| Range | 45.9% | 99.4% |
| Mean | 16.6% | 14.6% |
| Median | 14.3% | 12.6% |
| Interquartile 25% (IQ1) | 10.7% | 8.5% |
| Interquartile 75% (IQ3) | 18.9% | 16.2% |
| Interquartile Range (IQR) | 8.3% | 7.7% |
| Standard Deviation (Sample) | 9.6% | 13.2% |
| Standard Deviation (Population) | 9.5% | 13.2% |
Similar Demographics by Child Poverty Under the Age of 5
Demographics Similar to Palestinians by Child Poverty Under the Age of 5
In terms of child poverty under the age of 5, the demographic groups most similar to Palestinians are Immigrants from Canada (15.8%, a difference of 0.010%), Immigrants from Zimbabwe (15.8%, a difference of 0.020%), Immigrants from South Africa (15.8%, a difference of 0.11%), Armenian (15.8%, a difference of 0.15%), and Macedonian (15.8%, a difference of 0.18%).
| Demographics | Rating | Rank | Child Poverty Under the Age of 5 |
| Scandinavians | 97.1 /100 | #92 | Exceptional 15.7% |
| Ukrainians | 97.1 /100 | #93 | Exceptional 15.7% |
| Immigrants | South Eastern Asia | 97.1 /100 | #94 | Exceptional 15.7% |
| Immigrants | Switzerland | 96.4 /100 | #95 | Exceptional 15.8% |
| Immigrants | Kazakhstan | 96.2 /100 | #96 | Exceptional 15.8% |
| Macedonians | 96.2 /100 | #97 | Exceptional 15.8% |
| Immigrants | South Africa | 96.1 /100 | #98 | Exceptional 15.8% |
| Palestinians | 95.9 /100 | #99 | Exceptional 15.8% |
| Immigrants | Canada | 95.9 /100 | #100 | Exceptional 15.8% |
| Immigrants | Zimbabwe | 95.9 /100 | #101 | Exceptional 15.8% |
| Armenians | 95.7 /100 | #102 | Exceptional 15.8% |
| Europeans | 95.3 /100 | #103 | Exceptional 15.9% |
| Immigrants | North America | 94.9 /100 | #104 | Exceptional 15.9% |
| Immigrants | Spain | 94.8 /100 | #105 | Exceptional 15.9% |
| Tlingit-Haida | 94.7 /100 | #106 | Exceptional 15.9% |
Demographics Similar to Immigrants from Bolivia by Child Poverty Under the Age of 5
In terms of child poverty under the age of 5, the demographic groups most similar to Immigrants from Bolivia are Bolivian (13.8%, a difference of 0.080%), Immigrants from Japan (13.8%, a difference of 0.38%), Bulgarian (13.9%, a difference of 0.44%), Immigrants from Ireland (13.7%, a difference of 0.78%), and Asian (14.0%, a difference of 0.96%).
| Demographics | Rating | Rank | Child Poverty Under the Age of 5 |
| Indians (Asian) | 100.0 /100 | #15 | Exceptional 13.4% |
| Immigrants | Eastern Asia | 100.0 /100 | #16 | Exceptional 13.5% |
| Assyrians/Chaldeans/Syriacs | 100.0 /100 | #17 | Exceptional 13.6% |
| Immigrants | China | 100.0 /100 | #18 | Exceptional 13.6% |
| Immigrants | Ireland | 100.0 /100 | #19 | Exceptional 13.7% |
| Immigrants | Japan | 100.0 /100 | #20 | Exceptional 13.8% |
| Bolivians | 100.0 /100 | #21 | Exceptional 13.8% |
| Immigrants | Bolivia | 100.0 /100 | #22 | Exceptional 13.8% |
| Bulgarians | 99.9 /100 | #23 | Exceptional 13.9% |
| Asians | 99.9 /100 | #24 | Exceptional 14.0% |
| Cypriots | 99.9 /100 | #25 | Exceptional 14.0% |
| Immigrants | Lithuania | 99.9 /100 | #26 | Exceptional 14.1% |
| Tongans | 99.9 /100 | #27 | Exceptional 14.2% |
| Immigrants | Indonesia | 99.8 /100 | #28 | Exceptional 14.3% |
| Immigrants | Asia | 99.8 /100 | #29 | Exceptional 14.4% |