Pakistani vs Spanish Male Poverty
COMPARE
Pakistani
Spanish
Male Poverty
Male Poverty Comparison
Pakistanis
Spanish
10.8%
MALE POVERTY
83.0/ 100
METRIC RATING
133rd/ 347
METRIC RANK
11.7%
MALE POVERTY
14.1/ 100
METRIC RATING
199th/ 347
METRIC RANK
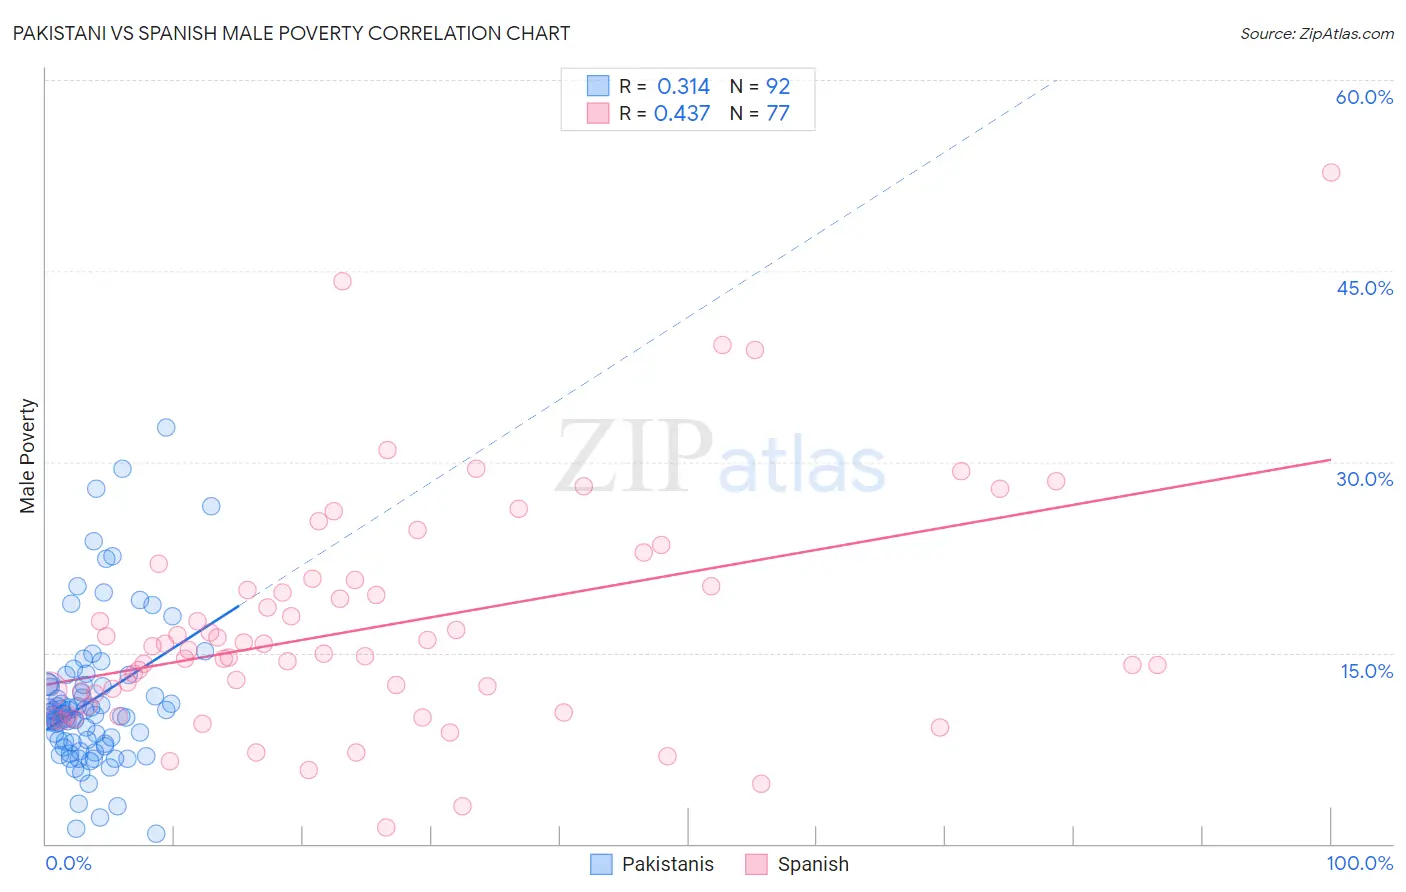
Pakistani vs Spanish Male Poverty Correlation Chart
The statistical analysis conducted on geographies consisting of 335,136,890 people shows a mild positive correlation between the proportion of Pakistanis and poverty level among males in the United States with a correlation coefficient (R) of 0.314 and weighted average of 10.8%. Similarly, the statistical analysis conducted on geographies consisting of 421,778,178 people shows a moderate positive correlation between the proportion of Spanish and poverty level among males in the United States with a correlation coefficient (R) of 0.437 and weighted average of 11.7%, a difference of 8.6%.
Male Poverty Correlation Summary
| Measurement | Pakistani | Spanish |
| Minimum | 0.75% | 1.2% |
| Maximum | 32.7% | 52.7% |
| Range | 32.0% | 51.5% |
| Mean | 11.2% | 17.1% |
| Median | 10.2% | 15.2% |
| Interquartile 25% (IQ1) | 7.9% | 11.3% |
| Interquartile 75% (IQ3) | 12.5% | 20.4% |
| Interquartile Range (IQR) | 4.6% | 9.1% |
| Standard Deviation (Sample) | 5.8% | 9.1% |
| Standard Deviation (Population) | 5.8% | 9.0% |
Similar Demographics by Male Poverty
Demographics Similar to Pakistanis by Male Poverty
In terms of male poverty, the demographic groups most similar to Pakistanis are Immigrants from Vietnam (10.8%, a difference of 0.010%), New Zealander (10.8%, a difference of 0.010%), Brazilian (10.8%, a difference of 0.050%), Immigrants from Belarus (10.7%, a difference of 0.060%), and Chilean (10.7%, a difference of 0.17%).
| Demographics | Rating | Rank | Male Poverty |
| Immigrants | Ukraine | 84.3 /100 | #126 | Excellent 10.7% |
| Puget Sound Salish | 84.3 /100 | #127 | Excellent 10.7% |
| Immigrants | Western Europe | 84.2 /100 | #128 | Excellent 10.7% |
| Immigrants | Peru | 84.1 /100 | #129 | Excellent 10.7% |
| Chileans | 83.9 /100 | #130 | Excellent 10.7% |
| Immigrants | Belarus | 83.3 /100 | #131 | Excellent 10.7% |
| Immigrants | Vietnam | 83.0 /100 | #132 | Excellent 10.8% |
| Pakistanis | 83.0 /100 | #133 | Excellent 10.8% |
| New Zealanders | 82.9 /100 | #134 | Excellent 10.8% |
| Brazilians | 82.7 /100 | #135 | Excellent 10.8% |
| Immigrants | Israel | 80.9 /100 | #136 | Excellent 10.8% |
| Immigrants | Switzerland | 79.2 /100 | #137 | Good 10.8% |
| Yugoslavians | 78.2 /100 | #138 | Good 10.8% |
| Immigrants | Jordan | 77.5 /100 | #139 | Good 10.8% |
| Tlingit-Haida | 76.1 /100 | #140 | Good 10.9% |
Demographics Similar to Spanish by Male Poverty
In terms of male poverty, the demographic groups most similar to Spanish are Immigrants from Lebanon (11.7%, a difference of 0.10%), Iraqi (11.7%, a difference of 0.11%), Spaniard (11.7%, a difference of 0.11%), Delaware (11.7%, a difference of 0.24%), and Arab (11.6%, a difference of 0.31%).
| Demographics | Rating | Rank | Male Poverty |
| Immigrants | Uruguay | 19.1 /100 | #192 | Poor 11.6% |
| Immigrants | Kuwait | 17.3 /100 | #193 | Poor 11.6% |
| Immigrants | Kenya | 16.1 /100 | #194 | Poor 11.6% |
| Arabs | 15.8 /100 | #195 | Poor 11.6% |
| Hmong | 15.8 /100 | #196 | Poor 11.6% |
| Delaware | 15.4 /100 | #197 | Poor 11.7% |
| Iraqis | 14.7 /100 | #198 | Poor 11.7% |
| Spanish | 14.1 /100 | #199 | Poor 11.7% |
| Immigrants | Lebanon | 13.6 /100 | #200 | Poor 11.7% |
| Spaniards | 13.5 /100 | #201 | Poor 11.7% |
| Aleuts | 10.4 /100 | #202 | Poor 11.8% |
| Immigrants | Western Asia | 9.8 /100 | #203 | Tragic 11.8% |
| Immigrants | Uganda | 8.5 /100 | #204 | Tragic 11.8% |
| Panamanians | 6.2 /100 | #205 | Tragic 11.9% |
| Immigrants | Eastern Africa | 5.4 /100 | #206 | Tragic 12.0% |