Laotian vs Immigrants from Grenada Female Poverty Among 25-34 Year Olds
COMPARE
Laotian
Immigrants from Grenada
Female Poverty Among 25-34 Year Olds
Female Poverty Among 25-34 Year Olds Comparison
Laotians
Immigrants from Grenada
12.2%
FEMALE POVERTY AMONG 25-34 YEAR OLDS
99.2/ 100
METRIC RATING
67th/ 347
METRIC RANK
14.7%
FEMALE POVERTY AMONG 25-34 YEAR OLDS
1.3/ 100
METRIC RATING
240th/ 347
METRIC RANK
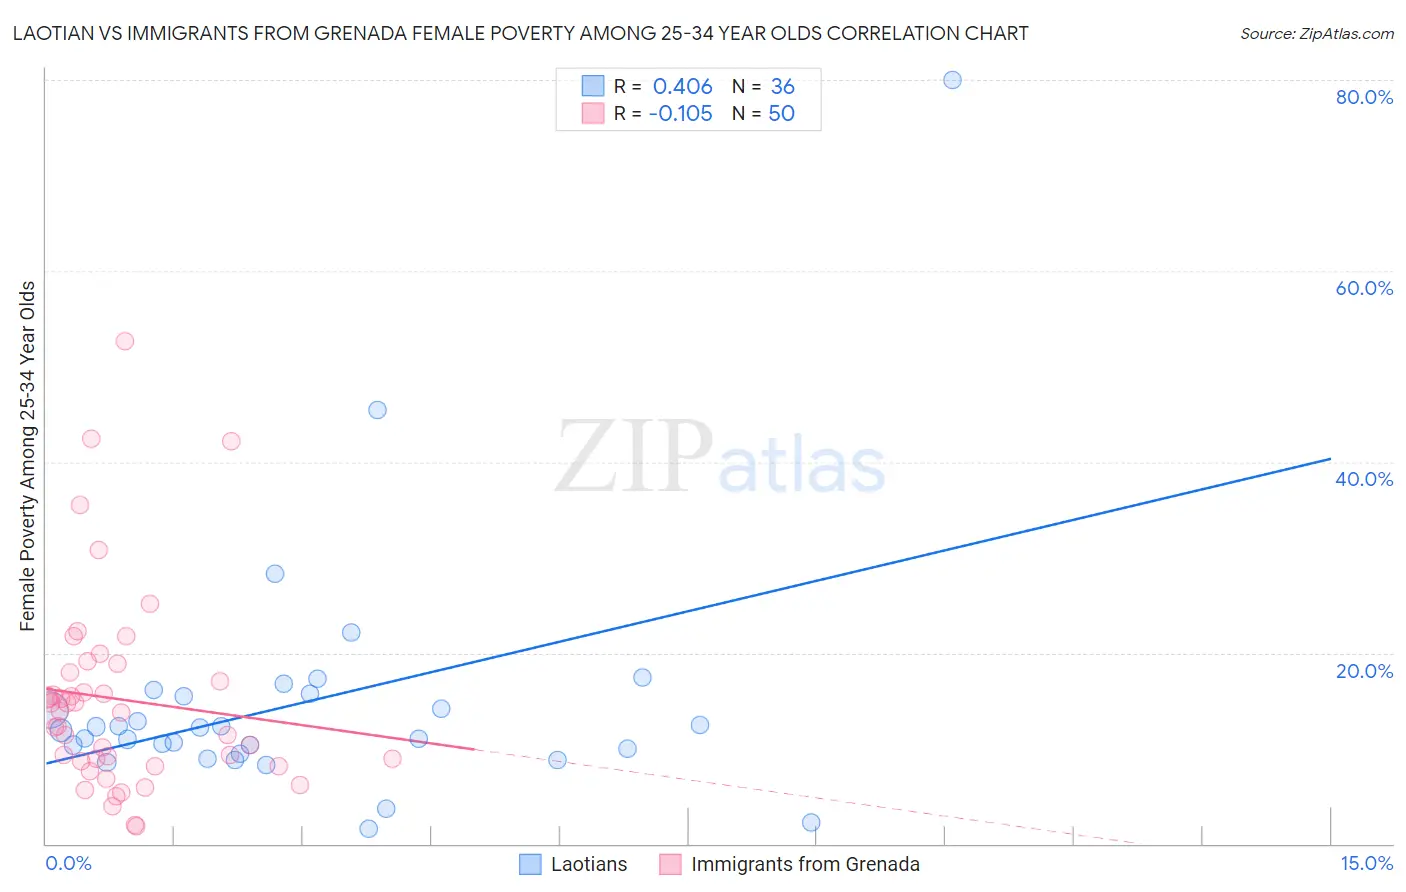
Laotian vs Immigrants from Grenada Female Poverty Among 25-34 Year Olds Correlation Chart
The statistical analysis conducted on geographies consisting of 223,063,253 people shows a moderate positive correlation between the proportion of Laotians and poverty level among females between the ages 25 and 34 in the United States with a correlation coefficient (R) of 0.406 and weighted average of 12.2%. Similarly, the statistical analysis conducted on geographies consisting of 67,009,327 people shows a poor negative correlation between the proportion of Immigrants from Grenada and poverty level among females between the ages 25 and 34 in the United States with a correlation coefficient (R) of -0.105 and weighted average of 14.7%, a difference of 21.0%.
Female Poverty Among 25-34 Year Olds Correlation Summary
| Measurement | Laotian | Immigrants from Grenada |
| Minimum | 1.6% | 1.9% |
| Maximum | 80.0% | 52.7% |
| Range | 78.4% | 50.8% |
| Mean | 14.8% | 15.1% |
| Median | 12.0% | 13.8% |
| Interquartile 25% (IQ1) | 9.7% | 8.6% |
| Interquartile 75% (IQ3) | 15.5% | 17.9% |
| Interquartile Range (IQR) | 5.8% | 9.3% |
| Standard Deviation (Sample) | 13.4% | 10.4% |
| Standard Deviation (Population) | 13.2% | 10.3% |
Similar Demographics by Female Poverty Among 25-34 Year Olds
Demographics Similar to Laotians by Female Poverty Among 25-34 Year Olds
In terms of female poverty among 25-34 year olds, the demographic groups most similar to Laotians are Immigrants from Europe (12.2%, a difference of 0.12%), Armenian (12.2%, a difference of 0.17%), Immigrants from Russia (12.2%, a difference of 0.19%), Sri Lankan (12.2%, a difference of 0.21%), and Immigrants from Lebanon (12.2%, a difference of 0.23%).
| Demographics | Rating | Rank | Female Poverty Among 25-34 Year Olds |
| Immigrants | Northern Europe | 99.4 /100 | #60 | Exceptional 12.1% |
| Immigrants | Czechoslovakia | 99.4 /100 | #61 | Exceptional 12.1% |
| Immigrants | Moldova | 99.3 /100 | #62 | Exceptional 12.1% |
| Soviet Union | 99.3 /100 | #63 | Exceptional 12.1% |
| Immigrants | Russia | 99.2 /100 | #64 | Exceptional 12.2% |
| Armenians | 99.2 /100 | #65 | Exceptional 12.2% |
| Immigrants | Europe | 99.2 /100 | #66 | Exceptional 12.2% |
| Laotians | 99.2 /100 | #67 | Exceptional 12.2% |
| Sri Lankans | 99.1 /100 | #68 | Exceptional 12.2% |
| Immigrants | Lebanon | 99.1 /100 | #69 | Exceptional 12.2% |
| Immigrants | Belgium | 99.1 /100 | #70 | Exceptional 12.2% |
| Immigrants | Scotland | 99.1 /100 | #71 | Exceptional 12.2% |
| Lithuanians | 99.1 /100 | #72 | Exceptional 12.2% |
| Immigrants | Vietnam | 98.9 /100 | #73 | Exceptional 12.3% |
| Immigrants | Sweden | 98.9 /100 | #74 | Exceptional 12.3% |
Demographics Similar to Immigrants from Grenada by Female Poverty Among 25-34 Year Olds
In terms of female poverty among 25-34 year olds, the demographic groups most similar to Immigrants from Grenada are Malaysian (14.7%, a difference of 0.050%), Alsatian (14.7%, a difference of 0.080%), Salvadoran (14.7%, a difference of 0.12%), Immigrants from Ghana (14.7%, a difference of 0.12%), and Immigrants from Jamaica (14.7%, a difference of 0.14%).
| Demographics | Rating | Rank | Female Poverty Among 25-34 Year Olds |
| Whites/Caucasians | 1.8 /100 | #233 | Tragic 14.7% |
| Cubans | 1.6 /100 | #234 | Tragic 14.7% |
| Immigrants | Jamaica | 1.4 /100 | #235 | Tragic 14.7% |
| Salvadorans | 1.4 /100 | #236 | Tragic 14.7% |
| Immigrants | Ghana | 1.4 /100 | #237 | Tragic 14.7% |
| Alsatians | 1.4 /100 | #238 | Tragic 14.7% |
| Malaysians | 1.4 /100 | #239 | Tragic 14.7% |
| Immigrants | Grenada | 1.3 /100 | #240 | Tragic 14.7% |
| Scotch-Irish | 1.2 /100 | #241 | Tragic 14.8% |
| Barbadians | 1.2 /100 | #242 | Tragic 14.8% |
| Immigrants | Nicaragua | 1.1 /100 | #243 | Tragic 14.8% |
| Immigrants | Bangladesh | 1.1 /100 | #244 | Tragic 14.8% |
| Immigrants | Middle Africa | 1.0 /100 | #245 | Tragic 14.8% |
| Jamaicans | 1.0 /100 | #246 | Tragic 14.8% |
| German Russians | 0.8 /100 | #247 | Tragic 14.9% |