Immigrants from Albania vs Immigrants from Mexico Poverty
COMPARE
Immigrants from Albania
Immigrants from Mexico
Poverty
Poverty Comparison
Immigrants from Albania
Immigrants from Mexico
12.2%
POVERTY
57.7/ 100
METRIC RATING
165th/ 347
METRIC RANK
15.5%
POVERTY
0.0/ 100
METRIC RATING
304th/ 347
METRIC RANK
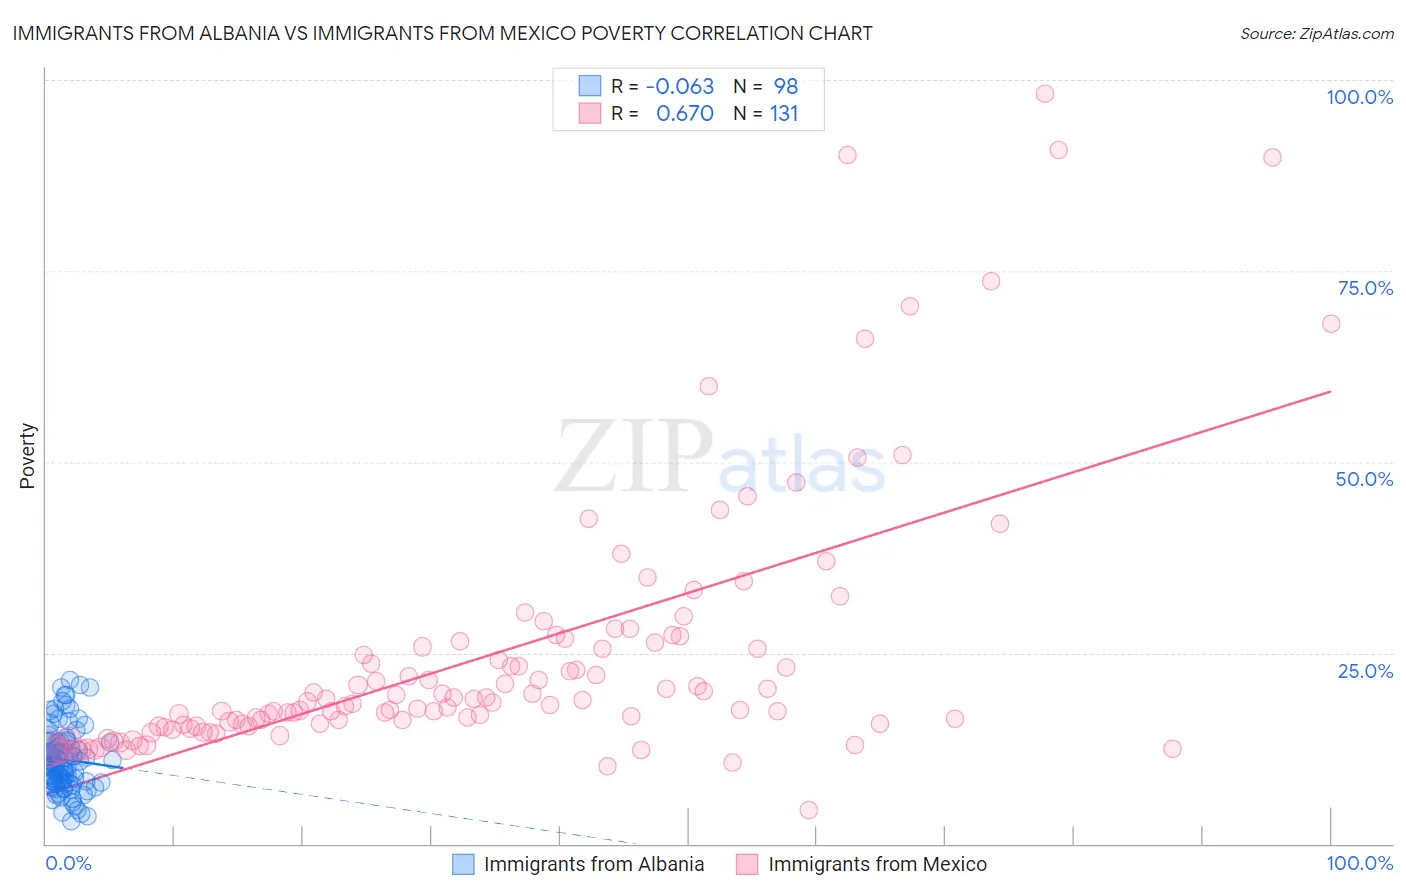
Immigrants from Albania vs Immigrants from Mexico Poverty Correlation Chart
The statistical analysis conducted on geographies consisting of 119,368,708 people shows a slight negative correlation between the proportion of Immigrants from Albania and poverty level in the United States with a correlation coefficient (R) of -0.063 and weighted average of 12.2%. Similarly, the statistical analysis conducted on geographies consisting of 513,374,473 people shows a significant positive correlation between the proportion of Immigrants from Mexico and poverty level in the United States with a correlation coefficient (R) of 0.670 and weighted average of 15.5%, a difference of 26.8%.
Poverty Correlation Summary
| Measurement | Immigrants from Albania | Immigrants from Mexico |
| Minimum | 3.0% | 4.4% |
| Maximum | 21.5% | 98.2% |
| Range | 18.6% | 93.8% |
| Mean | 11.0% | 24.6% |
| Median | 10.7% | 18.5% |
| Interquartile 25% (IQ1) | 8.0% | 15.4% |
| Interquartile 75% (IQ3) | 13.4% | 26.4% |
| Interquartile Range (IQR) | 5.4% | 11.0% |
| Standard Deviation (Sample) | 4.2% | 17.3% |
| Standard Deviation (Population) | 4.2% | 17.2% |
Similar Demographics by Poverty
Demographics Similar to Immigrants from Albania by Poverty
In terms of poverty, the demographic groups most similar to Immigrants from Albania are Colombian (12.2%, a difference of 0.010%), Immigrants from Ethiopia (12.2%, a difference of 0.080%), Venezuelan (12.2%, a difference of 0.090%), Immigrants from Chile (12.2%, a difference of 0.11%), and Immigrants from Venezuela (12.2%, a difference of 0.12%).
| Demographics | Rating | Rank | Poverty |
| Taiwanese | 61.8 /100 | #158 | Good 12.2% |
| Pennsylvania Germans | 60.8 /100 | #159 | Good 12.2% |
| Immigrants | Nepal | 60.4 /100 | #160 | Good 12.2% |
| Immigrants | Fiji | 59.1 /100 | #161 | Average 12.2% |
| Ethiopians | 59.1 /100 | #162 | Average 12.2% |
| Immigrants | Ethiopia | 58.6 /100 | #163 | Average 12.2% |
| Colombians | 57.8 /100 | #164 | Average 12.2% |
| Immigrants | Albania | 57.7 /100 | #165 | Average 12.2% |
| Venezuelans | 56.9 /100 | #166 | Average 12.2% |
| Immigrants | Chile | 56.7 /100 | #167 | Average 12.2% |
| Immigrants | Venezuela | 56.5 /100 | #168 | Average 12.2% |
| Whites/Caucasians | 55.4 /100 | #169 | Average 12.3% |
| Immigrants | Oceania | 54.6 /100 | #170 | Average 12.3% |
| Immigrants | Spain | 51.3 /100 | #171 | Average 12.3% |
| Immigrants | Portugal | 50.5 /100 | #172 | Average 12.3% |
Demographics Similar to Immigrants from Mexico by Poverty
In terms of poverty, the demographic groups most similar to Immigrants from Mexico are Immigrants from Guatemala (15.5%, a difference of 0.030%), Immigrants from Caribbean (15.5%, a difference of 0.090%), Creek (15.6%, a difference of 0.47%), African (15.6%, a difference of 0.54%), and Somali (15.4%, a difference of 0.57%).
| Demographics | Rating | Rank | Poverty |
| Immigrants | Bangladesh | 0.0 /100 | #297 | Tragic 15.3% |
| Immigrants | Senegal | 0.0 /100 | #298 | Tragic 15.3% |
| Senegalese | 0.0 /100 | #299 | Tragic 15.3% |
| Immigrants | Central America | 0.0 /100 | #300 | Tragic 15.4% |
| Bahamians | 0.0 /100 | #301 | Tragic 15.4% |
| Somalis | 0.0 /100 | #302 | Tragic 15.4% |
| Immigrants | Caribbean | 0.0 /100 | #303 | Tragic 15.5% |
| Immigrants | Mexico | 0.0 /100 | #304 | Tragic 15.5% |
| Immigrants | Guatemala | 0.0 /100 | #305 | Tragic 15.5% |
| Creek | 0.0 /100 | #306 | Tragic 15.6% |
| Africans | 0.0 /100 | #307 | Tragic 15.6% |
| Choctaw | 0.0 /100 | #308 | Tragic 15.6% |
| Seminole | 0.0 /100 | #309 | Tragic 15.6% |
| Dutch West Indians | 0.0 /100 | #310 | Tragic 15.6% |
| Chippewa | 0.0 /100 | #311 | Tragic 15.7% |