Paiute vs Filipino Single Mother Poverty
COMPARE
Paiute
Filipino
Single Mother Poverty
Single Mother Poverty Comparison
Paiute
Filipinos
35.1%
SINGLE MOTHER POVERTY
0.0/ 100
METRIC RATING
321st/ 347
METRIC RANK
24.3%
SINGLE MOTHER POVERTY
100.0/ 100
METRIC RATING
4th/ 347
METRIC RANK
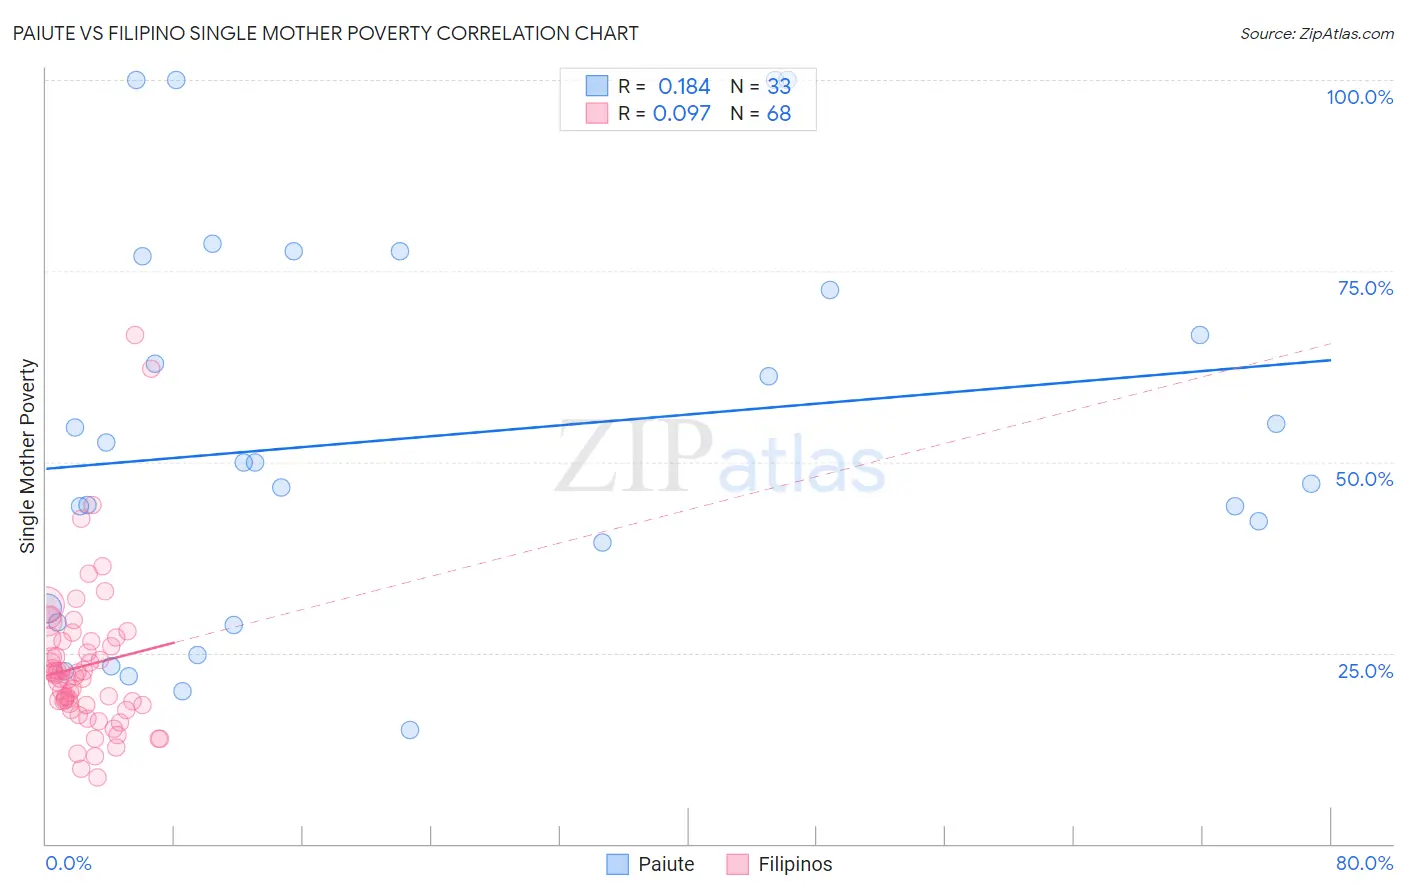
Paiute vs Filipino Single Mother Poverty Correlation Chart
The statistical analysis conducted on geographies consisting of 58,096,720 people shows a poor positive correlation between the proportion of Paiute and poverty level among single mothers in the United States with a correlation coefficient (R) of 0.184 and weighted average of 35.1%. Similarly, the statistical analysis conducted on geographies consisting of 249,212,409 people shows a slight positive correlation between the proportion of Filipinos and poverty level among single mothers in the United States with a correlation coefficient (R) of 0.097 and weighted average of 24.3%, a difference of 44.6%.
Single Mother Poverty Correlation Summary
| Measurement | Paiute | Filipino |
| Minimum | 14.8% | 8.6% |
| Maximum | 100.0% | 66.7% |
| Range | 85.2% | 58.1% |
| Mean | 53.3% | 23.3% |
| Median | 50.0% | 21.8% |
| Interquartile 25% (IQ1) | 29.9% | 18.2% |
| Interquartile 75% (IQ3) | 74.7% | 26.5% |
| Interquartile Range (IQR) | 44.8% | 8.3% |
| Standard Deviation (Sample) | 25.3% | 10.0% |
| Standard Deviation (Population) | 24.9% | 9.9% |
Similar Demographics by Single Mother Poverty
Demographics Similar to Paiute by Single Mother Poverty
In terms of single mother poverty, the demographic groups most similar to Paiute are Black/African American (35.2%, a difference of 0.20%), Iroquois (34.8%, a difference of 0.87%), Kiowa (35.5%, a difference of 0.91%), Chippewa (34.8%, a difference of 1.1%), and Ottawa (35.5%, a difference of 1.1%).
| Demographics | Rating | Rank | Single Mother Poverty |
| Chickasaw | 0.0 /100 | #314 | Tragic 34.4% |
| Hopi | 0.0 /100 | #315 | Tragic 34.5% |
| Dominicans | 0.0 /100 | #316 | Tragic 34.5% |
| Cherokee | 0.0 /100 | #317 | Tragic 34.5% |
| Immigrants | Honduras | 0.0 /100 | #318 | Tragic 34.7% |
| Chippewa | 0.0 /100 | #319 | Tragic 34.8% |
| Iroquois | 0.0 /100 | #320 | Tragic 34.8% |
| Paiute | 0.0 /100 | #321 | Tragic 35.1% |
| Blacks/African Americans | 0.0 /100 | #322 | Tragic 35.2% |
| Kiowa | 0.0 /100 | #323 | Tragic 35.5% |
| Ottawa | 0.0 /100 | #324 | Tragic 35.5% |
| Ute | 0.0 /100 | #325 | Tragic 35.7% |
| Seminole | 0.0 /100 | #326 | Tragic 35.8% |
| Yakama | 0.0 /100 | #327 | Tragic 36.4% |
| Choctaw | 0.0 /100 | #328 | Tragic 36.4% |
Demographics Similar to Filipinos by Single Mother Poverty
In terms of single mother poverty, the demographic groups most similar to Filipinos are Immigrants from Hong Kong (24.4%, a difference of 0.23%), Thai (24.5%, a difference of 0.72%), Chinese (24.6%, a difference of 1.3%), Immigrants from Taiwan (23.9%, a difference of 1.9%), and Immigrants from India (23.8%, a difference of 2.1%).
| Demographics | Rating | Rank | Single Mother Poverty |
| Assyrians/Chaldeans/Syriacs | 100.0 /100 | #1 | Exceptional 23.8% |
| Immigrants | India | 100.0 /100 | #2 | Exceptional 23.8% |
| Immigrants | Taiwan | 100.0 /100 | #3 | Exceptional 23.9% |
| Filipinos | 100.0 /100 | #4 | Exceptional 24.3% |
| Immigrants | Hong Kong | 100.0 /100 | #5 | Exceptional 24.4% |
| Thais | 100.0 /100 | #6 | Exceptional 24.5% |
| Chinese | 100.0 /100 | #7 | Exceptional 24.6% |
| Immigrants | Iran | 100.0 /100 | #8 | Exceptional 25.1% |
| Immigrants | Lithuania | 100.0 /100 | #9 | Exceptional 25.2% |
| Immigrants | South Central Asia | 100.0 /100 | #10 | Exceptional 25.3% |
| Iranians | 100.0 /100 | #11 | Exceptional 25.5% |
| Bhutanese | 100.0 /100 | #12 | Exceptional 25.6% |
| Indians (Asian) | 100.0 /100 | #13 | Exceptional 25.8% |
| Immigrants | Singapore | 100.0 /100 | #14 | Exceptional 25.8% |
| Immigrants | Ireland | 100.0 /100 | #15 | Exceptional 25.8% |