Okinawan vs Costa Rican Single Mother Poverty
COMPARE
Okinawan
Costa Rican
Single Mother Poverty
Single Mother Poverty Comparison
Okinawans
Costa Ricans
26.6%
SINGLE MOTHER POVERTY
99.9/ 100
METRIC RATING
36th/ 347
METRIC RANK
29.0%
SINGLE MOTHER POVERTY
58.4/ 100
METRIC RATING
167th/ 347
METRIC RANK
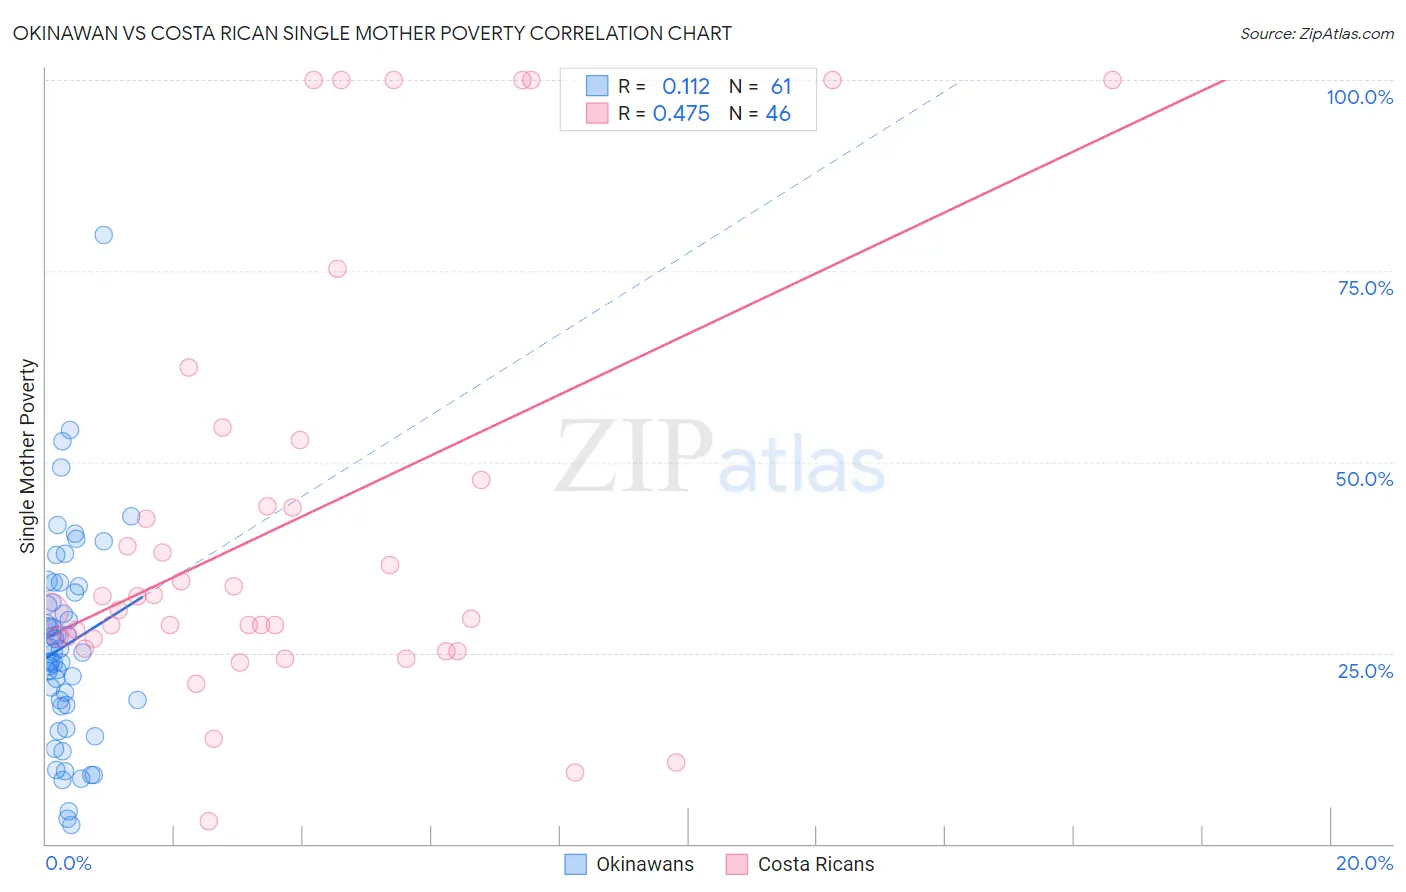
Okinawan vs Costa Rican Single Mother Poverty Correlation Chart
The statistical analysis conducted on geographies consisting of 73,055,809 people shows a poor positive correlation between the proportion of Okinawans and poverty level among single mothers in the United States with a correlation coefficient (R) of 0.112 and weighted average of 26.6%. Similarly, the statistical analysis conducted on geographies consisting of 249,968,027 people shows a moderate positive correlation between the proportion of Costa Ricans and poverty level among single mothers in the United States with a correlation coefficient (R) of 0.475 and weighted average of 29.0%, a difference of 9.2%.
Single Mother Poverty Correlation Summary
| Measurement | Okinawan | Costa Rican |
| Minimum | 2.5% | 3.0% |
| Maximum | 79.7% | 100.0% |
| Range | 77.3% | 97.0% |
| Mean | 26.0% | 42.4% |
| Median | 25.0% | 31.5% |
| Interquartile 25% (IQ1) | 18.1% | 26.9% |
| Interquartile 75% (IQ3) | 33.4% | 47.6% |
| Interquartile Range (IQR) | 15.3% | 20.7% |
| Standard Deviation (Sample) | 13.7% | 27.7% |
| Standard Deviation (Population) | 13.6% | 27.4% |
Similar Demographics by Single Mother Poverty
Demographics Similar to Okinawans by Single Mother Poverty
In terms of single mother poverty, the demographic groups most similar to Okinawans are Immigrants from Israel (26.6%, a difference of 0.0%), Immigrants from Fiji (26.6%, a difference of 0.040%), Maltese (26.6%, a difference of 0.050%), Immigrants from Indonesia (26.6%, a difference of 0.17%), and Bulgarian (26.5%, a difference of 0.18%).
| Demographics | Rating | Rank | Single Mother Poverty |
| Jordanians | 100.0 /100 | #29 | Exceptional 26.4% |
| Turks | 100.0 /100 | #30 | Exceptional 26.4% |
| Immigrants | Philippines | 100.0 /100 | #31 | Exceptional 26.5% |
| Tongans | 99.9 /100 | #32 | Exceptional 26.5% |
| Bulgarians | 99.9 /100 | #33 | Exceptional 26.5% |
| Immigrants | Indonesia | 99.9 /100 | #34 | Exceptional 26.6% |
| Maltese | 99.9 /100 | #35 | Exceptional 26.6% |
| Okinawans | 99.9 /100 | #36 | Exceptional 26.6% |
| Immigrants | Israel | 99.9 /100 | #37 | Exceptional 26.6% |
| Immigrants | Fiji | 99.9 /100 | #38 | Exceptional 26.6% |
| Sri Lankans | 99.9 /100 | #39 | Exceptional 26.7% |
| Immigrants | Vietnam | 99.9 /100 | #40 | Exceptional 26.7% |
| Immigrants | Greece | 99.9 /100 | #41 | Exceptional 26.7% |
| Armenians | 99.9 /100 | #42 | Exceptional 26.8% |
| Tsimshian | 99.9 /100 | #43 | Exceptional 26.8% |
Demographics Similar to Costa Ricans by Single Mother Poverty
In terms of single mother poverty, the demographic groups most similar to Costa Ricans are European (29.1%, a difference of 0.040%), Immigrants from Uruguay (29.1%, a difference of 0.060%), Inupiat (29.0%, a difference of 0.10%), Arab (29.0%, a difference of 0.12%), and New Zealander (29.1%, a difference of 0.16%).
| Demographics | Rating | Rank | Single Mother Poverty |
| Japanese | 68.0 /100 | #160 | Good 28.9% |
| Immigrants | Cambodia | 66.6 /100 | #161 | Good 28.9% |
| Scandinavians | 66.2 /100 | #162 | Good 28.9% |
| Immigrants | Nigeria | 65.9 /100 | #163 | Good 28.9% |
| Immigrants | Kenya | 65.9 /100 | #164 | Good 28.9% |
| Arabs | 60.7 /100 | #165 | Good 29.0% |
| Inupiat | 60.4 /100 | #166 | Good 29.0% |
| Costa Ricans | 58.4 /100 | #167 | Average 29.0% |
| Europeans | 57.6 /100 | #168 | Average 29.1% |
| Immigrants | Uruguay | 57.2 /100 | #169 | Average 29.1% |
| New Zealanders | 55.1 /100 | #170 | Average 29.1% |
| Puget Sound Salish | 55.1 /100 | #171 | Average 29.1% |
| Carpatho Rusyns | 53.8 /100 | #172 | Average 29.1% |
| British | 50.6 /100 | #173 | Average 29.2% |
| Immigrants | Saudi Arabia | 50.0 /100 | #174 | Average 29.2% |