Okinawan vs Immigrants from Saudi Arabia Child Poverty Among Girls Under 16
COMPARE
Okinawan
Immigrants from Saudi Arabia
Child Poverty Among Girls Under 16
Child Poverty Among Girls Under 16 Comparison
Okinawans
Immigrants from Saudi Arabia
13.0%
CHILD POVERTY AMONG GIRLS UNDER 16
99.9/ 100
METRIC RATING
15th/ 347
METRIC RANK
16.2%
CHILD POVERTY AMONG GIRLS UNDER 16
64.0/ 100
METRIC RATING
171st/ 347
METRIC RANK
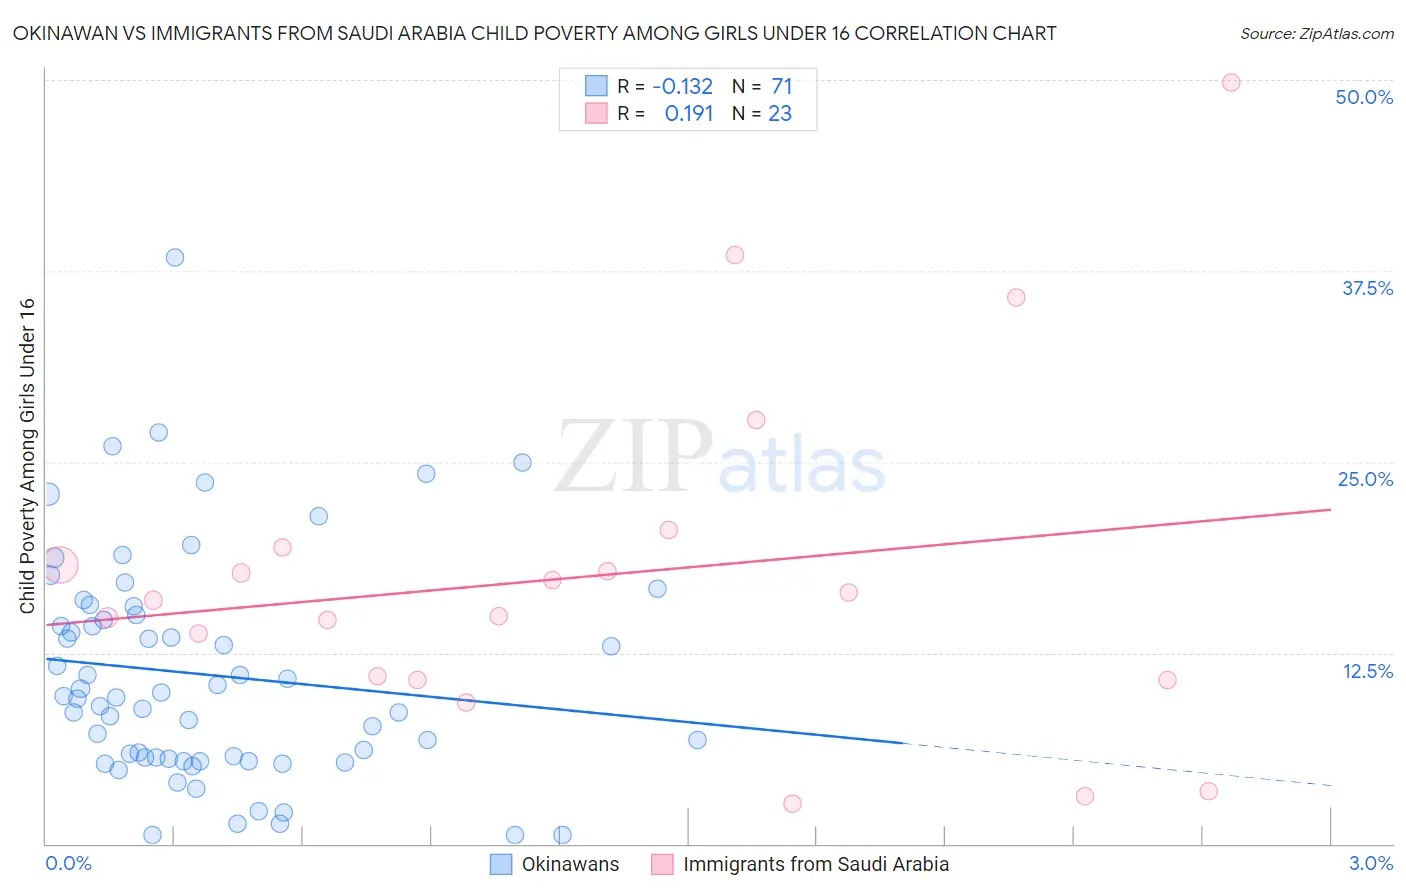
Okinawan vs Immigrants from Saudi Arabia Child Poverty Among Girls Under 16 Correlation Chart
The statistical analysis conducted on geographies consisting of 73,394,168 people shows a poor negative correlation between the proportion of Okinawans and poverty level among girls under the age of 16 in the United States with a correlation coefficient (R) of -0.132 and weighted average of 13.0%. Similarly, the statistical analysis conducted on geographies consisting of 163,265,067 people shows a poor positive correlation between the proportion of Immigrants from Saudi Arabia and poverty level among girls under the age of 16 in the United States with a correlation coefficient (R) of 0.191 and weighted average of 16.2%, a difference of 24.4%.
Child Poverty Among Girls Under 16 Correlation Summary
| Measurement | Okinawan | Immigrants from Saudi Arabia |
| Minimum | 0.54% | 2.6% |
| Maximum | 38.4% | 49.8% |
| Range | 37.9% | 47.2% |
| Mean | 11.1% | 17.6% |
| Median | 9.6% | 16.0% |
| Interquartile 25% (IQ1) | 5.6% | 10.7% |
| Interquartile 75% (IQ3) | 15.0% | 19.4% |
| Interquartile Range (IQR) | 9.4% | 8.7% |
| Standard Deviation (Sample) | 7.4% | 11.3% |
| Standard Deviation (Population) | 7.3% | 11.1% |
Similar Demographics by Child Poverty Among Girls Under 16
Demographics Similar to Okinawans by Child Poverty Among Girls Under 16
In terms of child poverty among girls under 16, the demographic groups most similar to Okinawans are Burmese (13.0%, a difference of 0.010%), Immigrants from Lithuania (13.1%, a difference of 0.92%), Bulgarian (13.1%, a difference of 1.0%), Immigrants from Korea (13.1%, a difference of 1.0%), and Immigrants from Ireland (12.9%, a difference of 1.1%).
| Demographics | Rating | Rank | Child Poverty Among Girls Under 16 |
| Iranians | 100.0 /100 | #8 | Exceptional 12.4% |
| Immigrants | Singapore | 100.0 /100 | #9 | Exceptional 12.5% |
| Immigrants | Iran | 100.0 /100 | #10 | Exceptional 12.6% |
| Immigrants | South Central Asia | 100.0 /100 | #11 | Exceptional 12.7% |
| Bhutanese | 100.0 /100 | #12 | Exceptional 12.7% |
| Immigrants | Ireland | 99.9 /100 | #13 | Exceptional 12.9% |
| Burmese | 99.9 /100 | #14 | Exceptional 13.0% |
| Okinawans | 99.9 /100 | #15 | Exceptional 13.0% |
| Immigrants | Lithuania | 99.9 /100 | #16 | Exceptional 13.1% |
| Bulgarians | 99.9 /100 | #17 | Exceptional 13.1% |
| Immigrants | Korea | 99.9 /100 | #18 | Exceptional 13.1% |
| Cypriots | 99.9 /100 | #19 | Exceptional 13.2% |
| Immigrants | Japan | 99.9 /100 | #20 | Exceptional 13.3% |
| Assyrians/Chaldeans/Syriacs | 99.9 /100 | #21 | Exceptional 13.3% |
| Indians (Asian) | 99.9 /100 | #22 | Exceptional 13.3% |
Demographics Similar to Immigrants from Saudi Arabia by Child Poverty Among Girls Under 16
In terms of child poverty among girls under 16, the demographic groups most similar to Immigrants from Saudi Arabia are Costa Rican (16.2%, a difference of 0.030%), Immigrants from Venezuela (16.2%, a difference of 0.030%), Yugoslavian (16.2%, a difference of 0.050%), Uruguayan (16.2%, a difference of 0.090%), and Afghan (16.2%, a difference of 0.21%).
| Demographics | Rating | Rank | Child Poverty Among Girls Under 16 |
| Immigrants | Colombia | 67.8 /100 | #164 | Good 16.1% |
| Immigrants | Germany | 67.3 /100 | #165 | Good 16.1% |
| South Americans | 67.2 /100 | #166 | Good 16.1% |
| Uruguayans | 64.7 /100 | #167 | Good 16.2% |
| Yugoslavians | 64.4 /100 | #168 | Good 16.2% |
| Costa Ricans | 64.2 /100 | #169 | Good 16.2% |
| Immigrants | Venezuela | 64.2 /100 | #170 | Good 16.2% |
| Immigrants | Saudi Arabia | 64.0 /100 | #171 | Good 16.2% |
| Afghans | 62.3 /100 | #172 | Good 16.2% |
| Immigrants | South America | 55.1 /100 | #173 | Average 16.4% |
| Ethiopians | 50.0 /100 | #174 | Average 16.5% |
| Lebanese | 45.4 /100 | #175 | Average 16.6% |
| Hungarians | 45.1 /100 | #176 | Average 16.6% |
| Immigrants | Western Asia | 44.1 /100 | #177 | Average 16.6% |
| Whites/Caucasians | 43.6 /100 | #178 | Average 16.6% |