Immigrants from Mexico vs Immigrants from Saudi Arabia Child Poverty Among Girls Under 16
COMPARE
Immigrants from Mexico
Immigrants from Saudi Arabia
Child Poverty Among Girls Under 16
Child Poverty Among Girls Under 16 Comparison
Immigrants from Mexico
Immigrants from Saudi Arabia
21.6%
CHILD POVERTY AMONG GIRLS UNDER 16
0.0/ 100
METRIC RATING
312th/ 347
METRIC RANK
16.2%
CHILD POVERTY AMONG GIRLS UNDER 16
64.0/ 100
METRIC RATING
171st/ 347
METRIC RANK
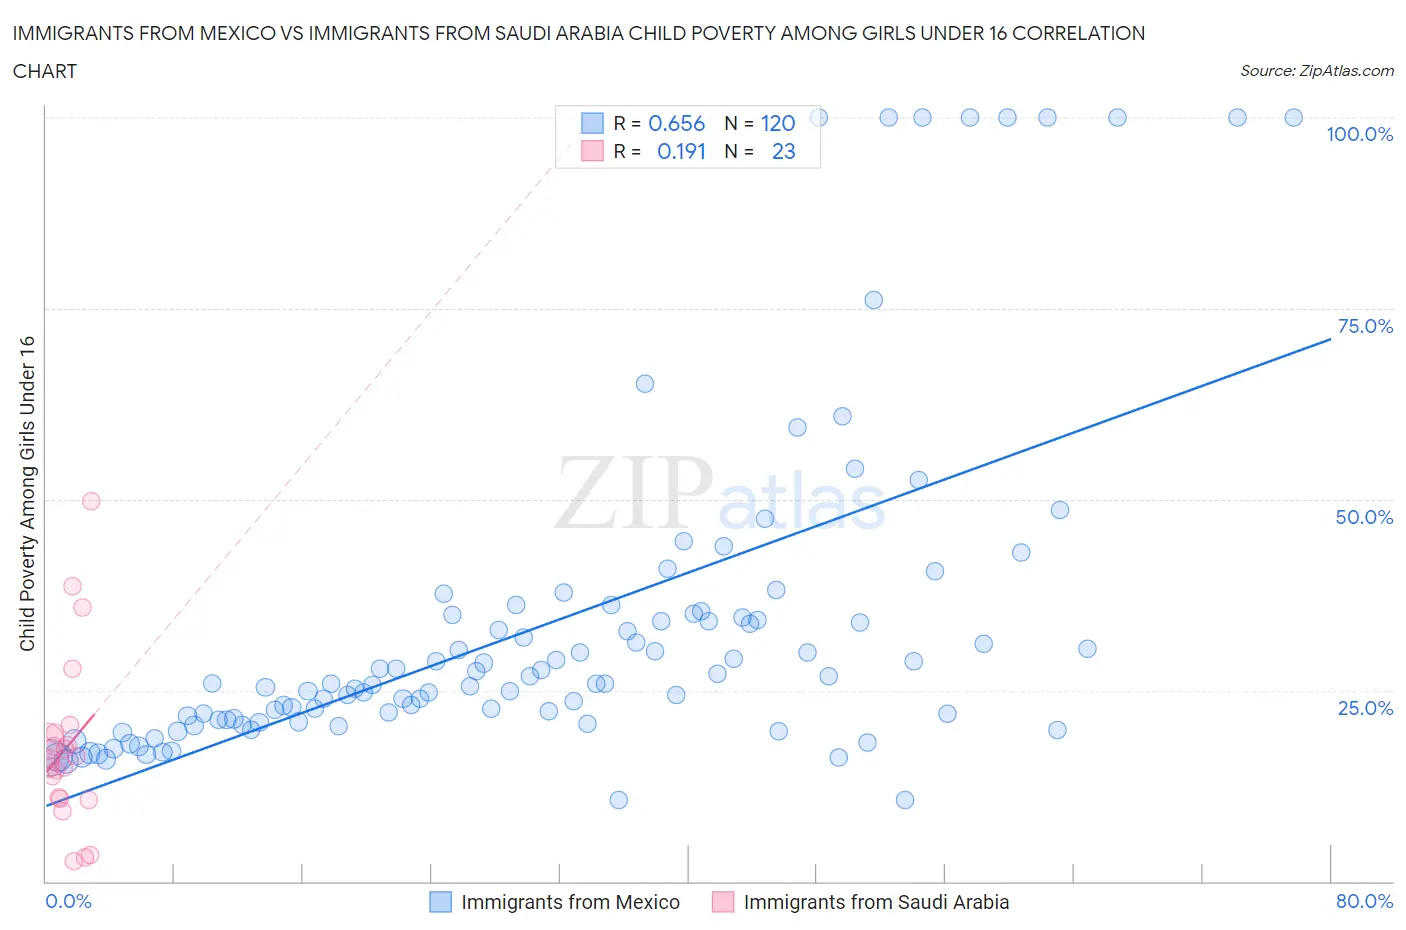
Immigrants from Mexico vs Immigrants from Saudi Arabia Child Poverty Among Girls Under 16 Correlation Chart
The statistical analysis conducted on geographies consisting of 501,744,550 people shows a significant positive correlation between the proportion of Immigrants from Mexico and poverty level among girls under the age of 16 in the United States with a correlation coefficient (R) of 0.656 and weighted average of 21.6%. Similarly, the statistical analysis conducted on geographies consisting of 163,265,067 people shows a poor positive correlation between the proportion of Immigrants from Saudi Arabia and poverty level among girls under the age of 16 in the United States with a correlation coefficient (R) of 0.191 and weighted average of 16.2%, a difference of 33.5%.
Child Poverty Among Girls Under 16 Correlation Summary
| Measurement | Immigrants from Mexico | Immigrants from Saudi Arabia |
| Minimum | 10.6% | 2.6% |
| Maximum | 100.0% | 49.8% |
| Range | 89.4% | 47.2% |
| Mean | 33.4% | 17.6% |
| Median | 25.9% | 16.0% |
| Interquartile 25% (IQ1) | 21.0% | 10.7% |
| Interquartile 75% (IQ3) | 34.7% | 19.4% |
| Interquartile Range (IQR) | 13.8% | 8.7% |
| Standard Deviation (Sample) | 21.9% | 11.3% |
| Standard Deviation (Population) | 21.8% | 11.1% |
Similar Demographics by Child Poverty Among Girls Under 16
Demographics Similar to Immigrants from Mexico by Child Poverty Among Girls Under 16
In terms of child poverty among girls under 16, the demographic groups most similar to Immigrants from Mexico are Dutch West Indian (21.6%, a difference of 0.23%), Immigrants from Somalia (21.6%, a difference of 0.29%), Creek (21.7%, a difference of 0.50%), Arapaho (21.7%, a difference of 0.51%), and Bahamian (21.5%, a difference of 0.56%).
| Demographics | Rating | Rank | Child Poverty Among Girls Under 16 |
| Guatemalans | 0.0 /100 | #305 | Tragic 21.4% |
| Immigrants | Central America | 0.0 /100 | #306 | Tragic 21.4% |
| Immigrants | Bahamas | 0.0 /100 | #307 | Tragic 21.4% |
| Houma | 0.0 /100 | #308 | Tragic 21.5% |
| Bahamians | 0.0 /100 | #309 | Tragic 21.5% |
| Immigrants | Somalia | 0.0 /100 | #310 | Tragic 21.6% |
| Dutch West Indians | 0.0 /100 | #311 | Tragic 21.6% |
| Immigrants | Mexico | 0.0 /100 | #312 | Tragic 21.6% |
| Creek | 0.0 /100 | #313 | Tragic 21.7% |
| Arapaho | 0.0 /100 | #314 | Tragic 21.7% |
| Ute | 0.0 /100 | #315 | Tragic 21.8% |
| Immigrants | Guatemala | 0.0 /100 | #316 | Tragic 21.9% |
| Africans | 0.0 /100 | #317 | Tragic 21.9% |
| Immigrants | Dominica | 0.0 /100 | #318 | Tragic 22.1% |
| U.S. Virgin Islanders | 0.0 /100 | #319 | Tragic 22.1% |
Demographics Similar to Immigrants from Saudi Arabia by Child Poverty Among Girls Under 16
In terms of child poverty among girls under 16, the demographic groups most similar to Immigrants from Saudi Arabia are Costa Rican (16.2%, a difference of 0.030%), Immigrants from Venezuela (16.2%, a difference of 0.030%), Yugoslavian (16.2%, a difference of 0.050%), Uruguayan (16.2%, a difference of 0.090%), and Afghan (16.2%, a difference of 0.21%).
| Demographics | Rating | Rank | Child Poverty Among Girls Under 16 |
| Immigrants | Colombia | 67.8 /100 | #164 | Good 16.1% |
| Immigrants | Germany | 67.3 /100 | #165 | Good 16.1% |
| South Americans | 67.2 /100 | #166 | Good 16.1% |
| Uruguayans | 64.7 /100 | #167 | Good 16.2% |
| Yugoslavians | 64.4 /100 | #168 | Good 16.2% |
| Costa Ricans | 64.2 /100 | #169 | Good 16.2% |
| Immigrants | Venezuela | 64.2 /100 | #170 | Good 16.2% |
| Immigrants | Saudi Arabia | 64.0 /100 | #171 | Good 16.2% |
| Afghans | 62.3 /100 | #172 | Good 16.2% |
| Immigrants | South America | 55.1 /100 | #173 | Average 16.4% |
| Ethiopians | 50.0 /100 | #174 | Average 16.5% |
| Lebanese | 45.4 /100 | #175 | Average 16.6% |
| Hungarians | 45.1 /100 | #176 | Average 16.6% |
| Immigrants | Western Asia | 44.1 /100 | #177 | Average 16.6% |
| Whites/Caucasians | 43.6 /100 | #178 | Average 16.6% |