Norwegian vs Indonesian Single Male Poverty
COMPARE
Norwegian
Indonesian
Single Male Poverty
Single Male Poverty Comparison
Norwegians
Indonesians
12.9%
SINGLE MALE POVERTY
32.0/ 100
METRIC RATING
185th/ 347
METRIC RANK
14.1%
SINGLE MALE POVERTY
0.0/ 100
METRIC RATING
279th/ 347
METRIC RANK
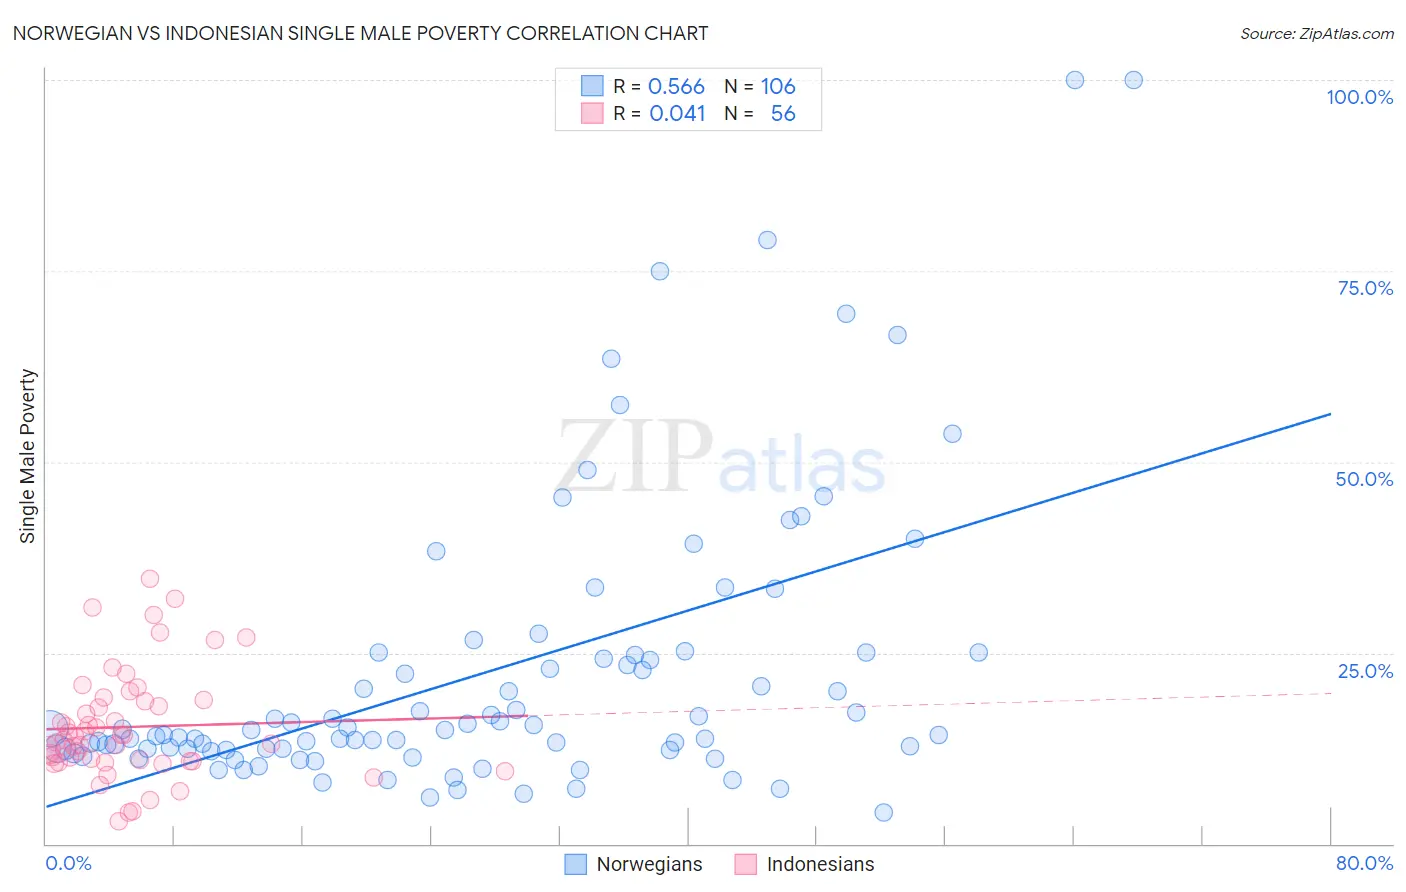
Norwegian vs Indonesian Single Male Poverty Correlation Chart
The statistical analysis conducted on geographies consisting of 445,954,160 people shows a substantial positive correlation between the proportion of Norwegians and poverty level among single males in the United States with a correlation coefficient (R) of 0.566 and weighted average of 12.9%. Similarly, the statistical analysis conducted on geographies consisting of 153,765,867 people shows no correlation between the proportion of Indonesians and poverty level among single males in the United States with a correlation coefficient (R) of 0.041 and weighted average of 14.1%, a difference of 9.1%.
Single Male Poverty Correlation Summary
| Measurement | Norwegian | Indonesian |
| Minimum | 4.2% | 2.9% |
| Maximum | 100.0% | 34.7% |
| Range | 95.8% | 31.8% |
| Mean | 22.4% | 15.3% |
| Median | 14.6% | 13.9% |
| Interquartile 25% (IQ1) | 12.4% | 10.8% |
| Interquartile 75% (IQ3) | 24.7% | 18.8% |
| Interquartile Range (IQR) | 12.3% | 8.0% |
| Standard Deviation (Sample) | 18.9% | 7.1% |
| Standard Deviation (Population) | 18.8% | 7.1% |
Similar Demographics by Single Male Poverty
Demographics Similar to Norwegians by Single Male Poverty
In terms of single male poverty, the demographic groups most similar to Norwegians are Nigerian (12.9%, a difference of 0.0%), Immigrants from Kuwait (12.9%, a difference of 0.010%), Immigrants from Trinidad and Tobago (12.9%, a difference of 0.030%), Macedonian (12.9%, a difference of 0.030%), and Immigrants from West Indies (12.9%, a difference of 0.060%).
| Demographics | Rating | Rank | Single Male Poverty |
| Immigrants | Switzerland | 43.1 /100 | #178 | Average 12.8% |
| Israelis | 41.0 /100 | #179 | Average 12.9% |
| Immigrants | North America | 37.7 /100 | #180 | Fair 12.9% |
| Panamanians | 37.6 /100 | #181 | Fair 12.9% |
| Moroccans | 36.8 /100 | #182 | Fair 12.9% |
| Immigrants | West Indies | 33.0 /100 | #183 | Fair 12.9% |
| Immigrants | Trinidad and Tobago | 32.5 /100 | #184 | Fair 12.9% |
| Norwegians | 32.0 /100 | #185 | Fair 12.9% |
| Nigerians | 31.9 /100 | #186 | Fair 12.9% |
| Immigrants | Kuwait | 31.9 /100 | #187 | Fair 12.9% |
| Macedonians | 31.5 /100 | #188 | Fair 12.9% |
| Portuguese | 30.2 /100 | #189 | Fair 12.9% |
| Arabs | 27.0 /100 | #190 | Fair 13.0% |
| Immigrants | Thailand | 26.6 /100 | #191 | Fair 13.0% |
| Immigrants | Jamaica | 26.5 /100 | #192 | Fair 13.0% |
Demographics Similar to Indonesians by Single Male Poverty
In terms of single male poverty, the demographic groups most similar to Indonesians are Slovak (14.1%, a difference of 0.040%), Immigrants from Honduras (14.1%, a difference of 0.10%), Dutch (14.1%, a difference of 0.14%), English (14.1%, a difference of 0.26%), and Honduran (14.0%, a difference of 0.34%).
| Demographics | Rating | Rank | Single Male Poverty |
| Mexicans | 0.1 /100 | #272 | Tragic 14.0% |
| Welsh | 0.1 /100 | #273 | Tragic 14.0% |
| Hondurans | 0.1 /100 | #274 | Tragic 14.0% |
| English | 0.1 /100 | #275 | Tragic 14.1% |
| Dutch | 0.1 /100 | #276 | Tragic 14.1% |
| Immigrants | Honduras | 0.0 /100 | #277 | Tragic 14.1% |
| Slovaks | 0.0 /100 | #278 | Tragic 14.1% |
| Indonesians | 0.0 /100 | #279 | Tragic 14.1% |
| Hmong | 0.0 /100 | #280 | Tragic 14.2% |
| Hispanics or Latinos | 0.0 /100 | #281 | Tragic 14.2% |
| Spanish Americans | 0.0 /100 | #282 | Tragic 14.2% |
| Yaqui | 0.0 /100 | #283 | Tragic 14.2% |
| Immigrants | Bahamas | 0.0 /100 | #284 | Tragic 14.4% |
| French | 0.0 /100 | #285 | Tragic 14.4% |
| Celtics | 0.0 /100 | #286 | Tragic 14.5% |