Northern European vs Immigrants from Ireland Receiving Food Stamps
COMPARE
Northern European
Immigrants from Ireland
Receiving Food Stamps
Receiving Food Stamps Comparison
Northern Europeans
Immigrants from Ireland
9.8%
RECEIVING FOOD STAMPS
99.0/ 100
METRIC RATING
68th/ 347
METRIC RANK
9.2%
RECEIVING FOOD STAMPS
99.8/ 100
METRIC RATING
25th/ 347
METRIC RANK
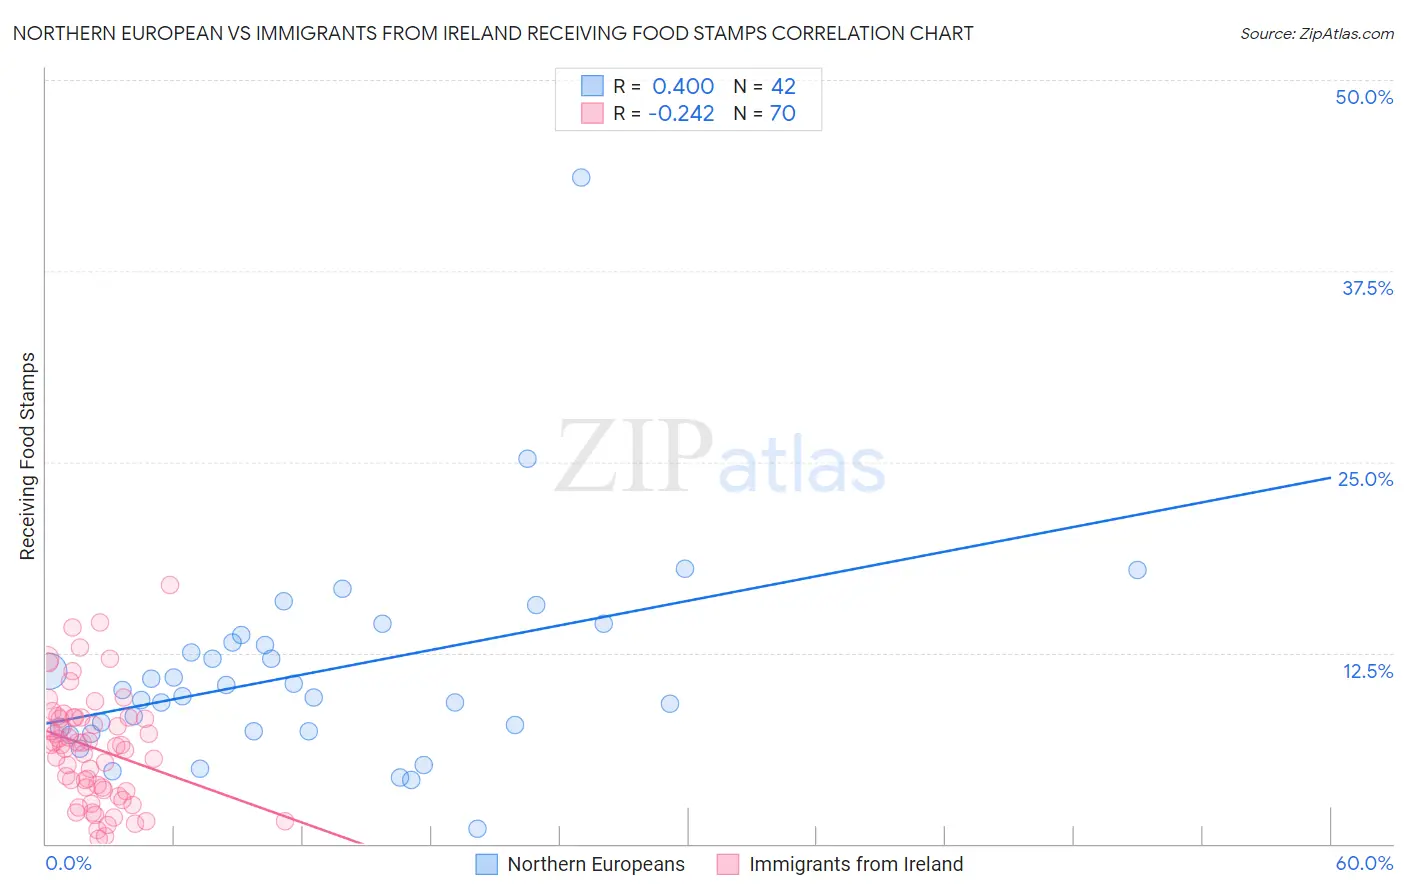
Northern European vs Immigrants from Ireland Receiving Food Stamps Correlation Chart
The statistical analysis conducted on geographies consisting of 404,897,441 people shows a moderate positive correlation between the proportion of Northern Europeans and percentage of population receiving government assistance and/or food stamps in the United States with a correlation coefficient (R) of 0.400 and weighted average of 9.8%. Similarly, the statistical analysis conducted on geographies consisting of 240,220,099 people shows a weak negative correlation between the proportion of Immigrants from Ireland and percentage of population receiving government assistance and/or food stamps in the United States with a correlation coefficient (R) of -0.242 and weighted average of 9.2%, a difference of 7.2%.
Receiving Food Stamps Correlation Summary
| Measurement | Northern European | Immigrants from Ireland |
| Minimum | 1.0% | 0.30% |
| Maximum | 43.6% | 16.9% |
| Range | 42.6% | 16.6% |
| Mean | 11.2% | 6.3% |
| Median | 9.9% | 6.5% |
| Interquartile 25% (IQ1) | 7.4% | 3.5% |
| Interquartile 75% (IQ3) | 13.2% | 8.3% |
| Interquartile Range (IQR) | 5.8% | 4.7% |
| Standard Deviation (Sample) | 6.8% | 3.6% |
| Standard Deviation (Population) | 6.8% | 3.6% |
Similar Demographics by Receiving Food Stamps
Demographics Similar to Northern Europeans by Receiving Food Stamps
In terms of receiving food stamps, the demographic groups most similar to Northern Europeans are Immigrants from Indonesia (9.8%, a difference of 0.060%), Italian (9.9%, a difference of 0.21%), Slovene (9.8%, a difference of 0.22%), Immigrants from Serbia (9.9%, a difference of 0.26%), and Scottish (9.9%, a difference of 0.39%).
| Demographics | Rating | Rank | Receiving Food Stamps |
| English | 99.2 /100 | #61 | Exceptional 9.8% |
| Immigrants | Bulgaria | 99.2 /100 | #62 | Exceptional 9.8% |
| Chinese | 99.2 /100 | #63 | Exceptional 9.8% |
| Immigrants | North America | 99.2 /100 | #64 | Exceptional 9.8% |
| Immigrants | Turkey | 99.1 /100 | #65 | Exceptional 9.8% |
| Slovenes | 99.1 /100 | #66 | Exceptional 9.8% |
| Immigrants | Indonesia | 99.0 /100 | #67 | Exceptional 9.8% |
| Northern Europeans | 99.0 /100 | #68 | Exceptional 9.8% |
| Italians | 99.0 /100 | #69 | Exceptional 9.9% |
| Immigrants | Serbia | 99.0 /100 | #70 | Exceptional 9.9% |
| Scottish | 98.9 /100 | #71 | Exceptional 9.9% |
| Immigrants | Asia | 98.9 /100 | #72 | Exceptional 9.9% |
| Macedonians | 98.9 /100 | #73 | Exceptional 9.9% |
| New Zealanders | 98.8 /100 | #74 | Exceptional 9.9% |
| Immigrants | Zimbabwe | 98.7 /100 | #75 | Exceptional 9.9% |
Demographics Similar to Immigrants from Ireland by Receiving Food Stamps
In terms of receiving food stamps, the demographic groups most similar to Immigrants from Ireland are Immigrants from Northern Europe (9.2%, a difference of 0.10%), Eastern European (9.2%, a difference of 0.13%), Swedish (9.2%, a difference of 0.20%), Immigrants from Australia (9.2%, a difference of 0.24%), and Bhutanese (9.2%, a difference of 0.43%).
| Demographics | Rating | Rank | Receiving Food Stamps |
| Danes | 99.9 /100 | #18 | Exceptional 9.0% |
| Immigrants | Hong Kong | 99.8 /100 | #19 | Exceptional 9.1% |
| Latvians | 99.8 /100 | #20 | Exceptional 9.1% |
| Luxembourgers | 99.8 /100 | #21 | Exceptional 9.1% |
| Immigrants | Australia | 99.8 /100 | #22 | Exceptional 9.2% |
| Eastern Europeans | 99.8 /100 | #23 | Exceptional 9.2% |
| Immigrants | Northern Europe | 99.8 /100 | #24 | Exceptional 9.2% |
| Immigrants | Ireland | 99.8 /100 | #25 | Exceptional 9.2% |
| Swedes | 99.8 /100 | #26 | Exceptional 9.2% |
| Bhutanese | 99.8 /100 | #27 | Exceptional 9.2% |
| Czechs | 99.8 /100 | #28 | Exceptional 9.2% |
| Immigrants | Lithuania | 99.8 /100 | #29 | Exceptional 9.2% |
| Immigrants | Sweden | 99.7 /100 | #30 | Exceptional 9.3% |
| Immigrants | Eastern Asia | 99.7 /100 | #31 | Exceptional 9.3% |
| Bolivians | 99.7 /100 | #32 | Exceptional 9.3% |