Immigrants from Denmark vs Greek Single Male Poverty
COMPARE
Immigrants from Denmark
Greek
Single Male Poverty
Single Male Poverty Comparison
Immigrants from Denmark
Greeks
13.2%
SINGLE MALE POVERTY
8.7/ 100
METRIC RATING
225th/ 347
METRIC RANK
12.7%
SINGLE MALE POVERTY
64.1/ 100
METRIC RATING
160th/ 347
METRIC RANK
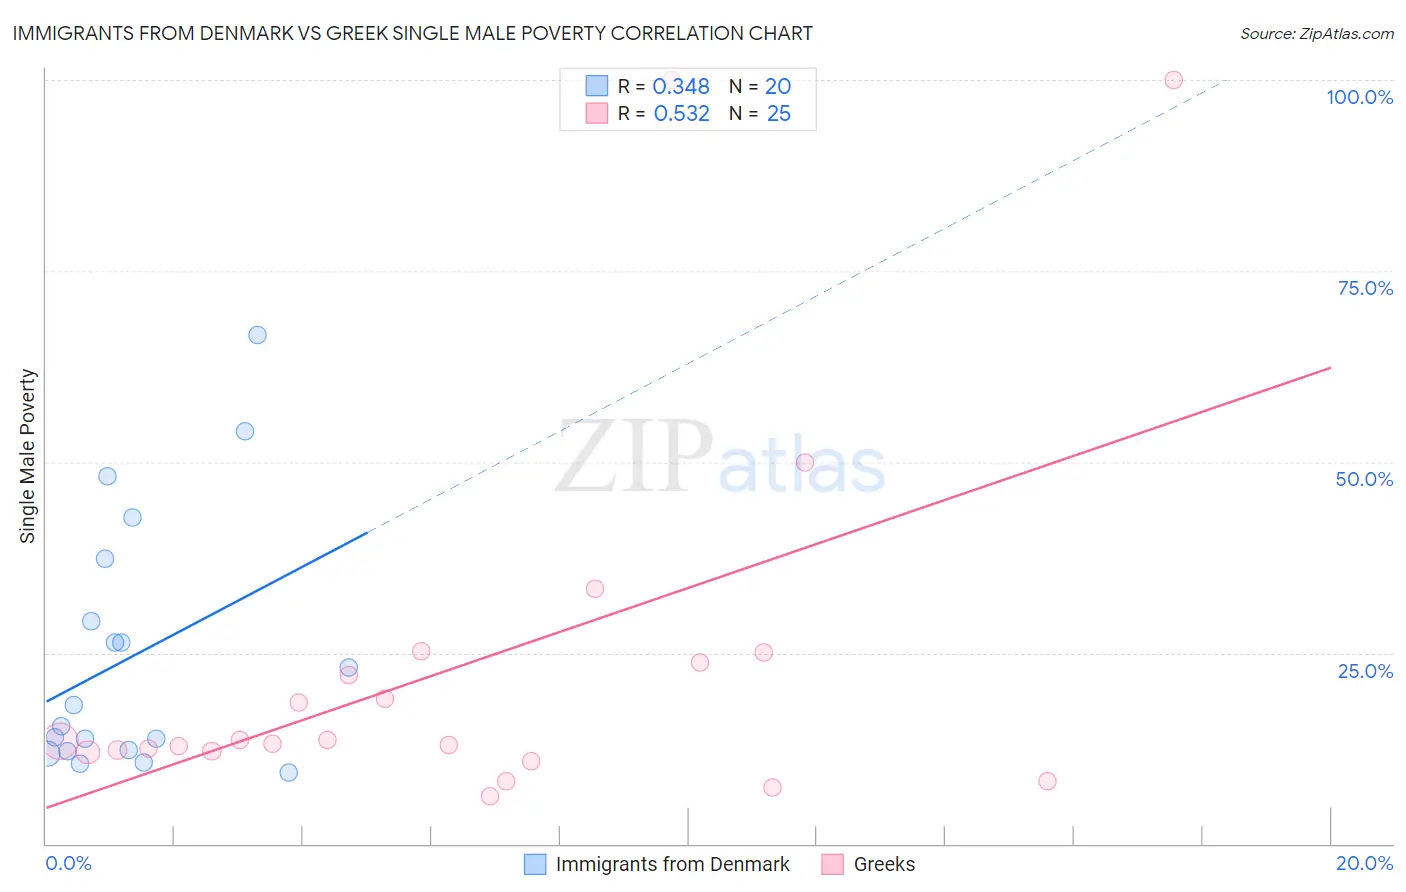
Immigrants from Denmark vs Greek Single Male Poverty Correlation Chart
The statistical analysis conducted on geographies consisting of 127,193,703 people shows a mild positive correlation between the proportion of Immigrants from Denmark and poverty level among single males in the United States with a correlation coefficient (R) of 0.348 and weighted average of 13.2%. Similarly, the statistical analysis conducted on geographies consisting of 412,862,309 people shows a substantial positive correlation between the proportion of Greeks and poverty level among single males in the United States with a correlation coefficient (R) of 0.532 and weighted average of 12.7%, a difference of 3.9%.
Single Male Poverty Correlation Summary
| Measurement | Immigrants from Denmark | Greek |
| Minimum | 9.3% | 6.2% |
| Maximum | 66.7% | 100.0% |
| Range | 57.4% | 93.8% |
| Mean | 24.8% | 23.4% |
| Median | 16.8% | 13.4% |
| Interquartile 25% (IQ1) | 12.2% | 12.1% |
| Interquartile 75% (IQ3) | 33.2% | 24.4% |
| Interquartile Range (IQR) | 21.1% | 12.3% |
| Standard Deviation (Sample) | 16.7% | 24.9% |
| Standard Deviation (Population) | 16.2% | 24.4% |
Similar Demographics by Single Male Poverty
Demographics Similar to Immigrants from Denmark by Single Male Poverty
In terms of single male poverty, the demographic groups most similar to Immigrants from Denmark are Somali (13.2%, a difference of 0.050%), Immigrants from the Azores (13.2%, a difference of 0.090%), Jamaican (13.2%, a difference of 0.16%), Immigrants from Western Europe (13.2%, a difference of 0.20%), and New Zealander (13.2%, a difference of 0.29%).
| Demographics | Rating | Rank | Single Male Poverty |
| Scandinavians | 12.9 /100 | #218 | Poor 13.1% |
| Immigrants | Burma/Myanmar | 12.6 /100 | #219 | Poor 13.1% |
| Central Americans | 10.9 /100 | #220 | Poor 13.2% |
| New Zealanders | 10.7 /100 | #221 | Poor 13.2% |
| Immigrants | Western Europe | 10.0 /100 | #222 | Poor 13.2% |
| Immigrants | Azores | 9.3 /100 | #223 | Tragic 13.2% |
| Somalis | 9.1 /100 | #224 | Tragic 13.2% |
| Immigrants | Denmark | 8.7 /100 | #225 | Tragic 13.2% |
| Jamaicans | 7.7 /100 | #226 | Tragic 13.2% |
| Haitians | 7.0 /100 | #227 | Tragic 13.2% |
| Lebanese | 6.6 /100 | #228 | Tragic 13.2% |
| Europeans | 6.2 /100 | #229 | Tragic 13.3% |
| Ghanaians | 6.1 /100 | #230 | Tragic 13.3% |
| Slavs | 5.3 /100 | #231 | Tragic 13.3% |
| Immigrants | Caribbean | 5.0 /100 | #232 | Tragic 13.3% |
Demographics Similar to Greeks by Single Male Poverty
In terms of single male poverty, the demographic groups most similar to Greeks are Immigrants from Liberia (12.7%, a difference of 0.0%), Immigrants from Middle Africa (12.7%, a difference of 0.040%), Immigrants from Africa (12.7%, a difference of 0.040%), Eastern European (12.7%, a difference of 0.050%), and Palestinian (12.7%, a difference of 0.060%).
| Demographics | Rating | Rank | Single Male Poverty |
| Immigrants | Immigrants | 70.1 /100 | #153 | Good 12.7% |
| Immigrants | Scotland | 68.9 /100 | #154 | Good 12.7% |
| Immigrants | Spain | 68.7 /100 | #155 | Good 12.7% |
| Vietnamese | 67.9 /100 | #156 | Good 12.7% |
| Latvians | 67.9 /100 | #157 | Good 12.7% |
| Immigrants | Middle Africa | 64.9 /100 | #158 | Good 12.7% |
| Immigrants | Liberia | 64.2 /100 | #159 | Good 12.7% |
| Greeks | 64.1 /100 | #160 | Good 12.7% |
| Immigrants | Africa | 63.4 /100 | #161 | Good 12.7% |
| Eastern Europeans | 63.3 /100 | #162 | Good 12.7% |
| Palestinians | 63.1 /100 | #163 | Good 12.7% |
| Immigrants | Nigeria | 62.8 /100 | #164 | Good 12.7% |
| Immigrants | Cambodia | 62.2 /100 | #165 | Good 12.7% |
| Immigrants | Guyana | 60.5 /100 | #166 | Good 12.7% |
| Immigrants | Sudan | 58.2 /100 | #167 | Average 12.7% |