Nepalese vs Greek Single Male Poverty
COMPARE
Nepalese
Greek
Single Male Poverty
Single Male Poverty Comparison
Nepalese
Greeks
11.6%
SINGLE MALE POVERTY
99.9/ 100
METRIC RATING
47th/ 347
METRIC RANK
12.7%
SINGLE MALE POVERTY
64.1/ 100
METRIC RATING
160th/ 347
METRIC RANK
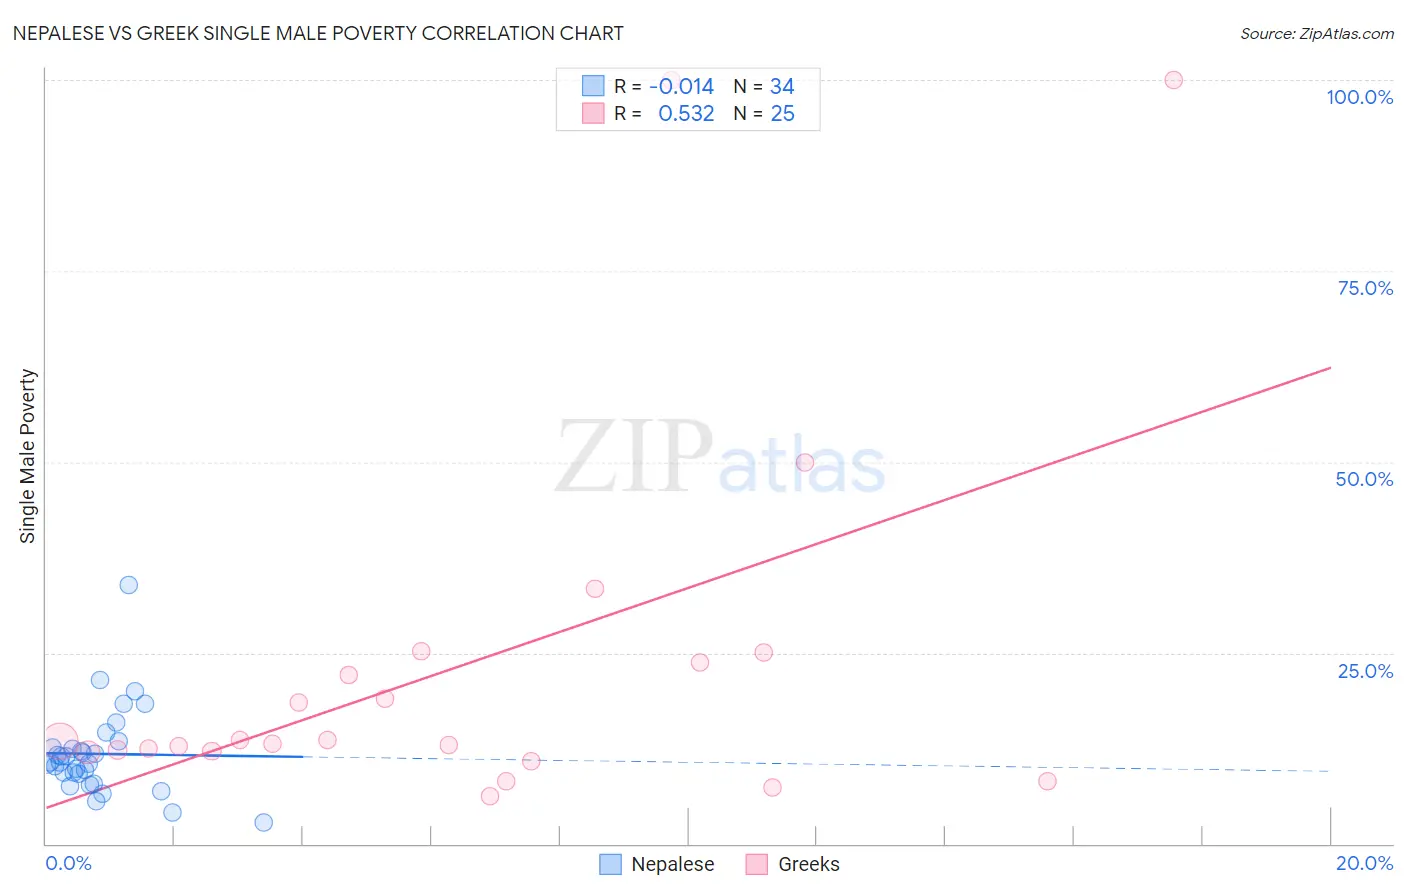
Nepalese vs Greek Single Male Poverty Correlation Chart
The statistical analysis conducted on geographies consisting of 24,210,854 people shows no correlation between the proportion of Nepalese and poverty level among single males in the United States with a correlation coefficient (R) of -0.014 and weighted average of 11.6%. Similarly, the statistical analysis conducted on geographies consisting of 412,862,309 people shows a substantial positive correlation between the proportion of Greeks and poverty level among single males in the United States with a correlation coefficient (R) of 0.532 and weighted average of 12.7%, a difference of 9.6%.
Single Male Poverty Correlation Summary
| Measurement | Nepalese | Greek |
| Minimum | 2.8% | 6.2% |
| Maximum | 33.9% | 100.0% |
| Range | 31.1% | 93.8% |
| Mean | 11.8% | 23.4% |
| Median | 10.7% | 13.4% |
| Interquartile 25% (IQ1) | 9.1% | 12.1% |
| Interquartile 75% (IQ3) | 12.7% | 24.4% |
| Interquartile Range (IQR) | 3.6% | 12.3% |
| Standard Deviation (Sample) | 5.7% | 24.9% |
| Standard Deviation (Population) | 5.6% | 24.4% |
Similar Demographics by Single Male Poverty
Demographics Similar to Nepalese by Single Male Poverty
In terms of single male poverty, the demographic groups most similar to Nepalese are Immigrants from Indonesia (11.6%, a difference of 0.080%), Tlingit-Haida (11.6%, a difference of 0.10%), Immigrants from Lithuania (11.6%, a difference of 0.15%), Immigrants from Bulgaria (11.6%, a difference of 0.20%), and Paraguayan (11.6%, a difference of 0.26%).
| Demographics | Rating | Rank | Single Male Poverty |
| Immigrants | Korea | 100.0 /100 | #40 | Exceptional 11.5% |
| Immigrants | Iraq | 99.9 /100 | #41 | Exceptional 11.5% |
| Egyptians | 99.9 /100 | #42 | Exceptional 11.5% |
| Immigrants | Peru | 99.9 /100 | #43 | Exceptional 11.5% |
| Immigrants | Cameroon | 99.9 /100 | #44 | Exceptional 11.5% |
| Immigrants | Poland | 99.9 /100 | #45 | Exceptional 11.5% |
| Immigrants | Bulgaria | 99.9 /100 | #46 | Exceptional 11.6% |
| Nepalese | 99.9 /100 | #47 | Exceptional 11.6% |
| Immigrants | Indonesia | 99.9 /100 | #48 | Exceptional 11.6% |
| Tlingit-Haida | 99.9 /100 | #49 | Exceptional 11.6% |
| Immigrants | Lithuania | 99.9 /100 | #50 | Exceptional 11.6% |
| Paraguayans | 99.9 /100 | #51 | Exceptional 11.6% |
| Samoans | 99.9 /100 | #52 | Exceptional 11.7% |
| Bulgarians | 99.9 /100 | #53 | Exceptional 11.7% |
| Immigrants | Uzbekistan | 99.9 /100 | #54 | Exceptional 11.7% |
Demographics Similar to Greeks by Single Male Poverty
In terms of single male poverty, the demographic groups most similar to Greeks are Immigrants from Liberia (12.7%, a difference of 0.0%), Immigrants from Middle Africa (12.7%, a difference of 0.040%), Immigrants from Africa (12.7%, a difference of 0.040%), Eastern European (12.7%, a difference of 0.050%), and Palestinian (12.7%, a difference of 0.060%).
| Demographics | Rating | Rank | Single Male Poverty |
| Immigrants | Immigrants | 70.1 /100 | #153 | Good 12.7% |
| Immigrants | Scotland | 68.9 /100 | #154 | Good 12.7% |
| Immigrants | Spain | 68.7 /100 | #155 | Good 12.7% |
| Vietnamese | 67.9 /100 | #156 | Good 12.7% |
| Latvians | 67.9 /100 | #157 | Good 12.7% |
| Immigrants | Middle Africa | 64.9 /100 | #158 | Good 12.7% |
| Immigrants | Liberia | 64.2 /100 | #159 | Good 12.7% |
| Greeks | 64.1 /100 | #160 | Good 12.7% |
| Immigrants | Africa | 63.4 /100 | #161 | Good 12.7% |
| Eastern Europeans | 63.3 /100 | #162 | Good 12.7% |
| Palestinians | 63.1 /100 | #163 | Good 12.7% |
| Immigrants | Nigeria | 62.8 /100 | #164 | Good 12.7% |
| Immigrants | Cambodia | 62.2 /100 | #165 | Good 12.7% |
| Immigrants | Guyana | 60.5 /100 | #166 | Good 12.7% |
| Immigrants | Sudan | 58.2 /100 | #167 | Average 12.7% |