Guatemalan vs Immigrants from Grenada Seniors Poverty Over the Age of 65
COMPARE
Guatemalan
Immigrants from Grenada
Seniors Poverty Over the Age of 65
Seniors Poverty Over the Age of 65 Comparison
Guatemalans
Immigrants from Grenada
13.5%
SENIORS POVERTY OVER THE AGE OF 65
0.0/ 100
METRIC RATING
285th/ 347
METRIC RANK
15.8%
SENIORS POVERTY OVER THE AGE OF 65
0.0/ 100
METRIC RATING
332nd/ 347
METRIC RANK
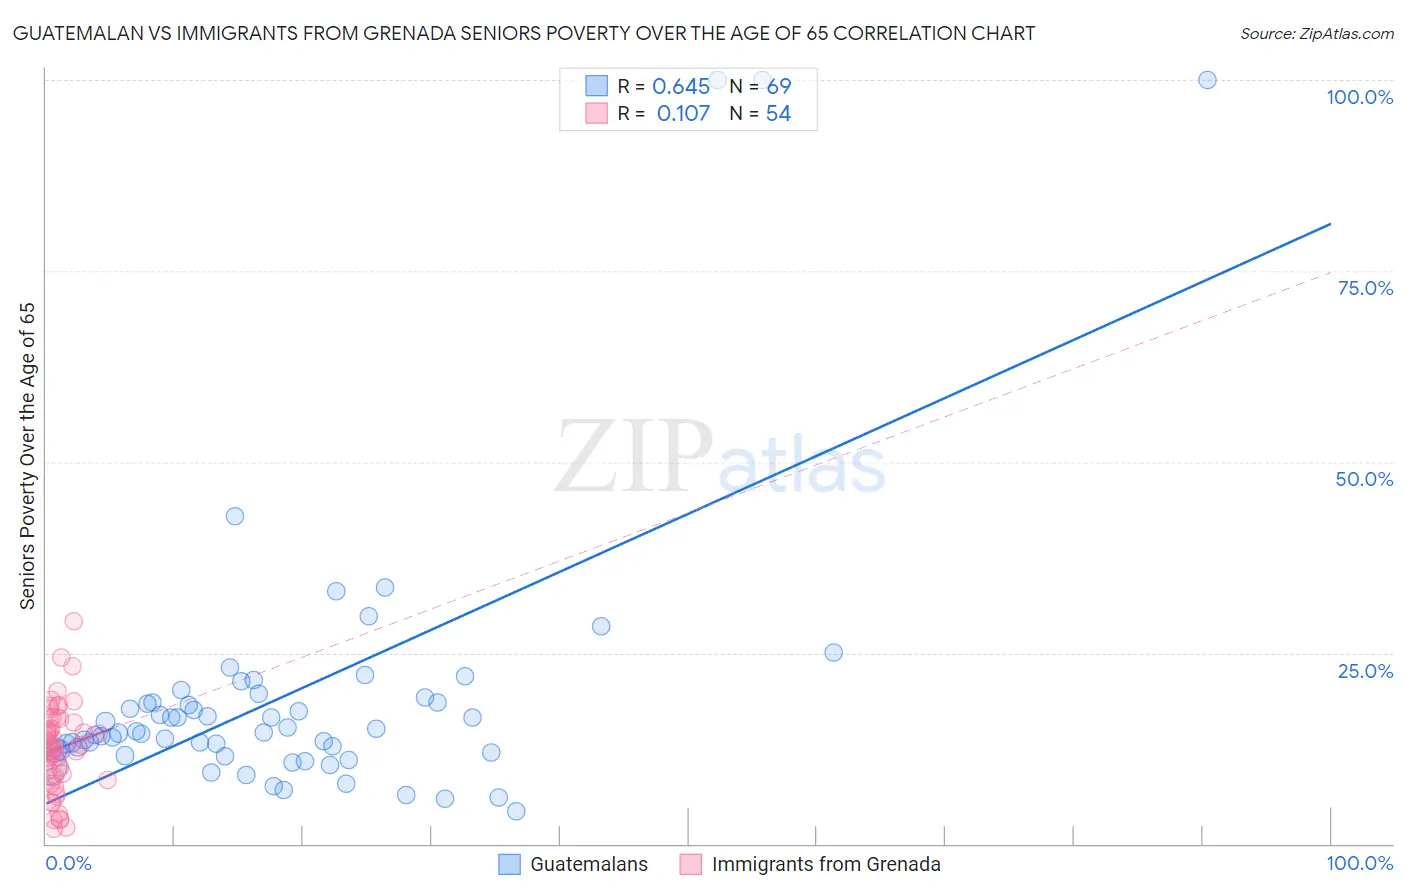
Guatemalan vs Immigrants from Grenada Seniors Poverty Over the Age of 65 Correlation Chart
The statistical analysis conducted on geographies consisting of 408,127,156 people shows a significant positive correlation between the proportion of Guatemalans and poverty level among seniors over the age of 65 in the United States with a correlation coefficient (R) of 0.645 and weighted average of 13.5%. Similarly, the statistical analysis conducted on geographies consisting of 67,080,367 people shows a poor positive correlation between the proportion of Immigrants from Grenada and poverty level among seniors over the age of 65 in the United States with a correlation coefficient (R) of 0.107 and weighted average of 15.8%, a difference of 16.9%.
Seniors Poverty Over the Age of 65 Correlation Summary
| Measurement | Guatemalan | Immigrants from Grenada |
| Minimum | 4.3% | 1.9% |
| Maximum | 100.0% | 29.2% |
| Range | 95.7% | 27.3% |
| Mean | 19.4% | 12.5% |
| Median | 14.6% | 12.7% |
| Interquartile 25% (IQ1) | 12.1% | 8.7% |
| Interquartile 75% (IQ3) | 18.8% | 16.3% |
| Interquartile Range (IQR) | 6.8% | 7.6% |
| Standard Deviation (Sample) | 18.6% | 5.8% |
| Standard Deviation (Population) | 18.4% | 5.7% |
Similar Demographics by Seniors Poverty Over the Age of 65
Demographics Similar to Guatemalans by Seniors Poverty Over the Age of 65
In terms of seniors poverty over the age of 65, the demographic groups most similar to Guatemalans are Colville (13.5%, a difference of 0.23%), Immigrants from Senegal (13.6%, a difference of 0.27%), Immigrants from Mexico (13.6%, a difference of 0.40%), Belizean (13.6%, a difference of 0.54%), and Jamaican (13.6%, a difference of 0.81%).
| Demographics | Rating | Rank | Seniors Poverty Over the Age of 65 |
| Immigrants | Bahamas | 0.0 /100 | #278 | Tragic 13.0% |
| Mexicans | 0.0 /100 | #279 | Tragic 13.1% |
| Yuman | 0.0 /100 | #280 | Tragic 13.1% |
| Immigrants | El Salvador | 0.0 /100 | #281 | Tragic 13.1% |
| Senegalese | 0.0 /100 | #282 | Tragic 13.3% |
| Central Americans | 0.0 /100 | #283 | Tragic 13.4% |
| Colville | 0.0 /100 | #284 | Tragic 13.5% |
| Guatemalans | 0.0 /100 | #285 | Tragic 13.5% |
| Immigrants | Senegal | 0.0 /100 | #286 | Tragic 13.6% |
| Immigrants | Mexico | 0.0 /100 | #287 | Tragic 13.6% |
| Belizeans | 0.0 /100 | #288 | Tragic 13.6% |
| Jamaicans | 0.0 /100 | #289 | Tragic 13.6% |
| Immigrants | Central America | 0.0 /100 | #290 | Tragic 13.6% |
| Blacks/African Americans | 0.0 /100 | #291 | Tragic 13.7% |
| Spanish American Indians | 0.0 /100 | #292 | Tragic 13.8% |
Demographics Similar to Immigrants from Grenada by Seniors Poverty Over the Age of 65
In terms of seniors poverty over the age of 65, the demographic groups most similar to Immigrants from Grenada are Immigrants from Yemen (15.9%, a difference of 0.44%), Immigrants from Nicaragua (15.9%, a difference of 0.58%), British West Indian (15.6%, a difference of 1.4%), Cuban (16.1%, a difference of 1.9%), and Immigrants from St. Vincent and the Grenadines (15.5%, a difference of 1.9%).
| Demographics | Rating | Rank | Seniors Poverty Over the Age of 65 |
| Central American Indians | 0.0 /100 | #325 | Tragic 15.1% |
| Immigrants | Armenia | 0.0 /100 | #326 | Tragic 15.2% |
| Crow | 0.0 /100 | #327 | Tragic 15.2% |
| Sioux | 0.0 /100 | #328 | Tragic 15.3% |
| Immigrants | Dominica | 0.0 /100 | #329 | Tragic 15.5% |
| Immigrants | St. Vincent and the Grenadines | 0.0 /100 | #330 | Tragic 15.5% |
| British West Indians | 0.0 /100 | #331 | Tragic 15.6% |
| Immigrants | Grenada | 0.0 /100 | #332 | Tragic 15.8% |
| Immigrants | Yemen | 0.0 /100 | #333 | Tragic 15.9% |
| Immigrants | Nicaragua | 0.0 /100 | #334 | Tragic 15.9% |
| Cubans | 0.0 /100 | #335 | Tragic 16.1% |
| Immigrants | Cabo Verde | 0.0 /100 | #336 | Tragic 16.2% |
| Immigrants | Caribbean | 0.0 /100 | #337 | Tragic 16.5% |
| Pueblo | 0.0 /100 | #338 | Tragic 17.2% |
| Navajo | 0.0 /100 | #339 | Tragic 17.5% |