Immigrants from Syria vs Immigrants from Grenada Seniors Poverty Over the Age of 65
COMPARE
Immigrants from Syria
Immigrants from Grenada
Seniors Poverty Over the Age of 65
Seniors Poverty Over the Age of 65 Comparison
Immigrants from Syria
Immigrants from Grenada
10.9%
SENIORS POVERTY OVER THE AGE OF 65
54.7/ 100
METRIC RATING
172nd/ 347
METRIC RANK
15.8%
SENIORS POVERTY OVER THE AGE OF 65
0.0/ 100
METRIC RATING
332nd/ 347
METRIC RANK
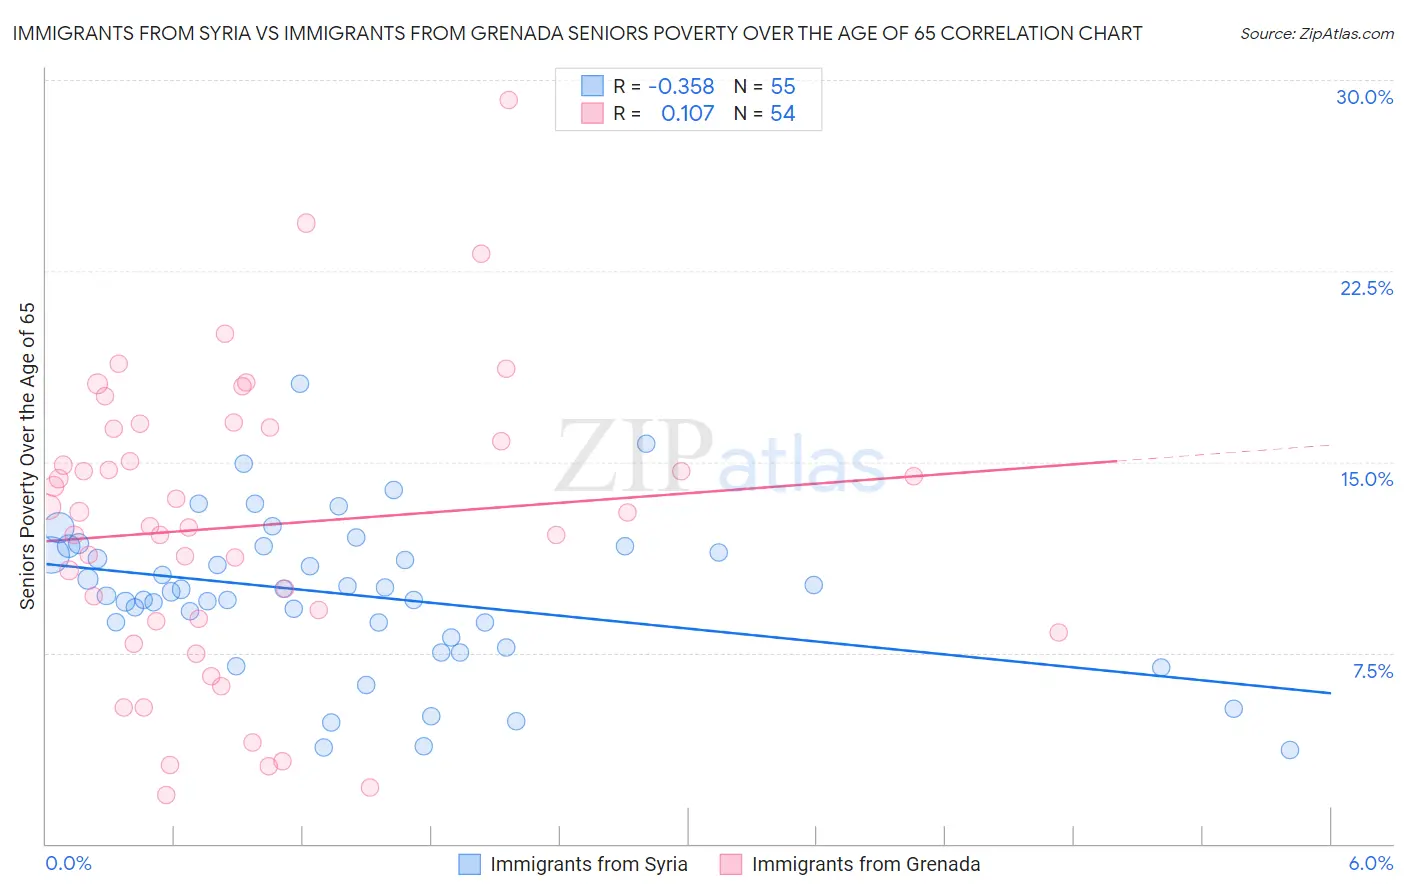
Immigrants from Syria vs Immigrants from Grenada Seniors Poverty Over the Age of 65 Correlation Chart
The statistical analysis conducted on geographies consisting of 173,928,413 people shows a mild negative correlation between the proportion of Immigrants from Syria and poverty level among seniors over the age of 65 in the United States with a correlation coefficient (R) of -0.358 and weighted average of 10.9%. Similarly, the statistical analysis conducted on geographies consisting of 67,080,367 people shows a poor positive correlation between the proportion of Immigrants from Grenada and poverty level among seniors over the age of 65 in the United States with a correlation coefficient (R) of 0.107 and weighted average of 15.8%, a difference of 45.2%.
Seniors Poverty Over the Age of 65 Correlation Summary
| Measurement | Immigrants from Syria | Immigrants from Grenada |
| Minimum | 3.7% | 1.9% |
| Maximum | 18.1% | 29.2% |
| Range | 14.4% | 27.3% |
| Mean | 9.8% | 12.5% |
| Median | 9.9% | 12.7% |
| Interquartile 25% (IQ1) | 8.1% | 8.7% |
| Interquartile 75% (IQ3) | 11.7% | 16.3% |
| Interquartile Range (IQR) | 3.6% | 7.6% |
| Standard Deviation (Sample) | 3.0% | 5.8% |
| Standard Deviation (Population) | 3.0% | 5.7% |
Similar Demographics by Seniors Poverty Over the Age of 65
Demographics Similar to Immigrants from Syria by Seniors Poverty Over the Age of 65
In terms of seniors poverty over the age of 65, the demographic groups most similar to Immigrants from Syria are Nonimmigrants (10.9%, a difference of 0.040%), Immigrants from Eastern Europe (10.9%, a difference of 0.10%), Sri Lankan (10.9%, a difference of 0.19%), Mongolian (10.9%, a difference of 0.30%), and Spaniard (10.9%, a difference of 0.35%).
| Demographics | Rating | Rank | Seniors Poverty Over the Age of 65 |
| Immigrants | South Eastern Asia | 62.1 /100 | #165 | Good 10.8% |
| Malaysians | 62.0 /100 | #166 | Good 10.8% |
| Alaska Natives | 60.3 /100 | #167 | Good 10.8% |
| Mongolians | 58.0 /100 | #168 | Average 10.9% |
| Sri Lankans | 56.8 /100 | #169 | Average 10.9% |
| Immigrants | Eastern Europe | 55.8 /100 | #170 | Average 10.9% |
| Immigrants | Nonimmigrants | 55.1 /100 | #171 | Average 10.9% |
| Immigrants | Syria | 54.7 /100 | #172 | Average 10.9% |
| Spaniards | 50.7 /100 | #173 | Average 10.9% |
| Immigrants | Sudan | 50.0 /100 | #174 | Average 10.9% |
| Creek | 49.6 /100 | #175 | Average 10.9% |
| Immigrants | Malaysia | 47.9 /100 | #176 | Average 11.0% |
| Cherokee | 47.3 /100 | #177 | Average 11.0% |
| German Russians | 46.9 /100 | #178 | Average 11.0% |
| Immigrants | Northern Africa | 44.6 /100 | #179 | Average 11.0% |
Demographics Similar to Immigrants from Grenada by Seniors Poverty Over the Age of 65
In terms of seniors poverty over the age of 65, the demographic groups most similar to Immigrants from Grenada are Immigrants from Yemen (15.9%, a difference of 0.44%), Immigrants from Nicaragua (15.9%, a difference of 0.58%), British West Indian (15.6%, a difference of 1.4%), Cuban (16.1%, a difference of 1.9%), and Immigrants from St. Vincent and the Grenadines (15.5%, a difference of 1.9%).
| Demographics | Rating | Rank | Seniors Poverty Over the Age of 65 |
| Central American Indians | 0.0 /100 | #325 | Tragic 15.1% |
| Immigrants | Armenia | 0.0 /100 | #326 | Tragic 15.2% |
| Crow | 0.0 /100 | #327 | Tragic 15.2% |
| Sioux | 0.0 /100 | #328 | Tragic 15.3% |
| Immigrants | Dominica | 0.0 /100 | #329 | Tragic 15.5% |
| Immigrants | St. Vincent and the Grenadines | 0.0 /100 | #330 | Tragic 15.5% |
| British West Indians | 0.0 /100 | #331 | Tragic 15.6% |
| Immigrants | Grenada | 0.0 /100 | #332 | Tragic 15.8% |
| Immigrants | Yemen | 0.0 /100 | #333 | Tragic 15.9% |
| Immigrants | Nicaragua | 0.0 /100 | #334 | Tragic 15.9% |
| Cubans | 0.0 /100 | #335 | Tragic 16.1% |
| Immigrants | Cabo Verde | 0.0 /100 | #336 | Tragic 16.2% |
| Immigrants | Caribbean | 0.0 /100 | #337 | Tragic 16.5% |
| Pueblo | 0.0 /100 | #338 | Tragic 17.2% |
| Navajo | 0.0 /100 | #339 | Tragic 17.5% |