Nigerian vs Slovak Female Poverty Among 25-34 Year Olds
COMPARE
Nigerian
Slovak
Female Poverty Among 25-34 Year Olds
Female Poverty Among 25-34 Year Olds Comparison
Nigerians
Slovaks
14.4%
FEMALE POVERTY AMONG 25-34 YEAR OLDS
4.2/ 100
METRIC RATING
223rd/ 347
METRIC RANK
13.7%
FEMALE POVERTY AMONG 25-34 YEAR OLDS
34.1/ 100
METRIC RATING
187th/ 347
METRIC RANK
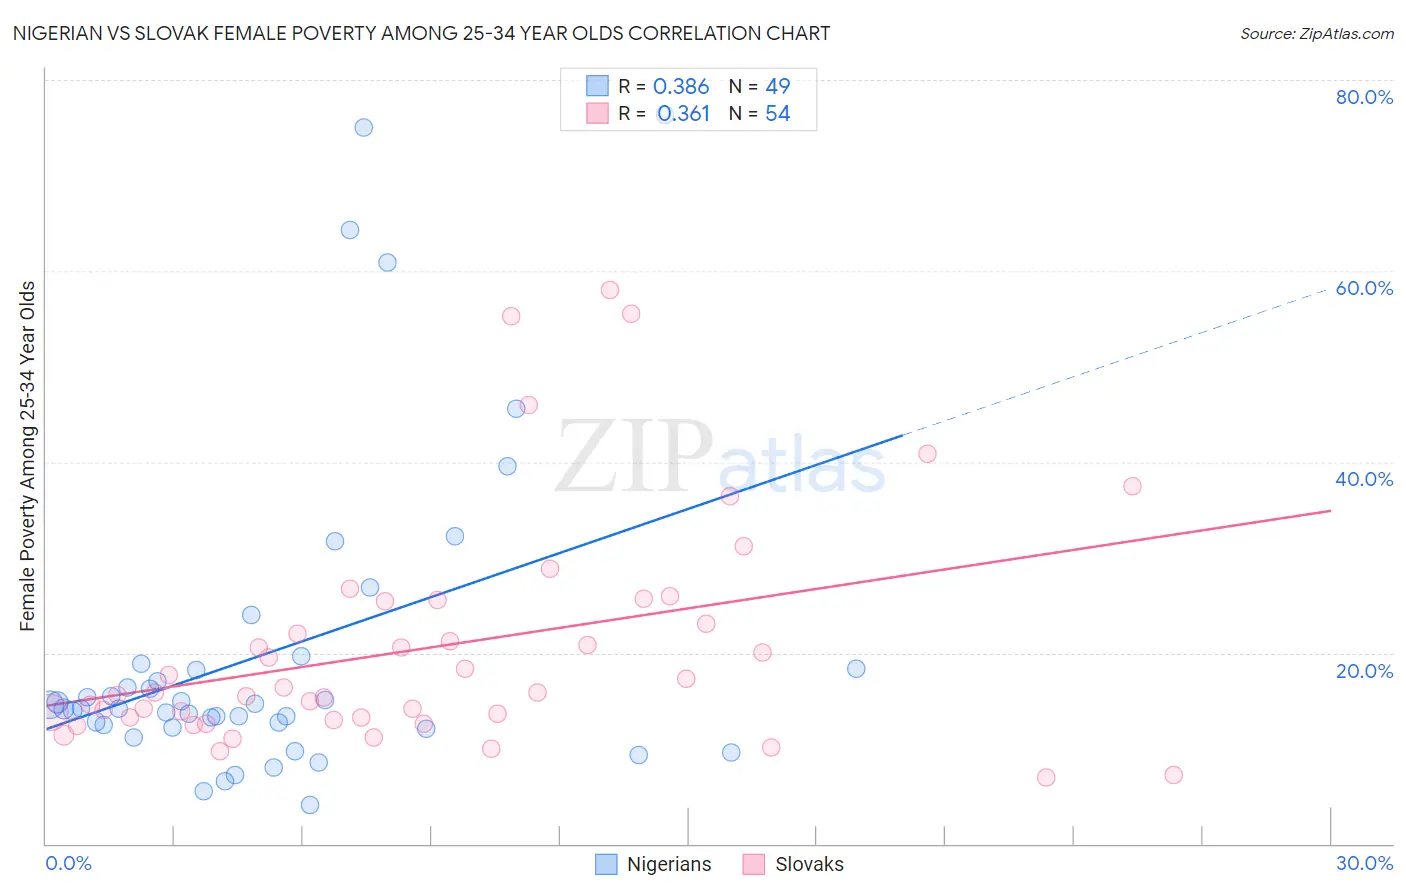
Nigerian vs Slovak Female Poverty Among 25-34 Year Olds Correlation Chart
The statistical analysis conducted on geographies consisting of 329,631,397 people shows a mild positive correlation between the proportion of Nigerians and poverty level among females between the ages 25 and 34 in the United States with a correlation coefficient (R) of 0.386 and weighted average of 14.4%. Similarly, the statistical analysis conducted on geographies consisting of 388,263,387 people shows a mild positive correlation between the proportion of Slovaks and poverty level among females between the ages 25 and 34 in the United States with a correlation coefficient (R) of 0.361 and weighted average of 13.7%, a difference of 5.1%.
Female Poverty Among 25-34 Year Olds Correlation Summary
| Measurement | Nigerian | Slovak |
| Minimum | 4.0% | 6.9% |
| Maximum | 76.3% | 58.1% |
| Range | 72.3% | 51.2% |
| Mean | 20.1% | 20.6% |
| Median | 14.2% | 15.8% |
| Interquartile 25% (IQ1) | 12.3% | 13.2% |
| Interquartile 75% (IQ3) | 18.6% | 25.3% |
| Interquartile Range (IQR) | 6.2% | 12.1% |
| Standard Deviation (Sample) | 16.8% | 12.0% |
| Standard Deviation (Population) | 16.7% | 11.9% |
Similar Demographics by Female Poverty Among 25-34 Year Olds
Demographics Similar to Nigerians by Female Poverty Among 25-34 Year Olds
In terms of female poverty among 25-34 year olds, the demographic groups most similar to Nigerians are Immigrants from Portugal (14.4%, a difference of 0.060%), Immigrants from Sudan (14.4%, a difference of 0.070%), Sudanese (14.4%, a difference of 0.13%), Ghanaian (14.4%, a difference of 0.29%), and Immigrants from Barbados (14.5%, a difference of 0.39%).
| Demographics | Rating | Rank | Female Poverty Among 25-34 Year Olds |
| French Canadians | 5.5 /100 | #216 | Tragic 14.3% |
| Spanish American Indians | 5.5 /100 | #217 | Tragic 14.3% |
| Immigrants | Thailand | 5.2 /100 | #218 | Tragic 14.3% |
| Ecuadorians | 5.2 /100 | #219 | Tragic 14.3% |
| Ghanaians | 4.8 /100 | #220 | Tragic 14.4% |
| Sudanese | 4.4 /100 | #221 | Tragic 14.4% |
| Immigrants | Portugal | 4.3 /100 | #222 | Tragic 14.4% |
| Nigerians | 4.2 /100 | #223 | Tragic 14.4% |
| Immigrants | Sudan | 4.0 /100 | #224 | Tragic 14.4% |
| Immigrants | Barbados | 3.4 /100 | #225 | Tragic 14.5% |
| Nicaraguans | 3.3 /100 | #226 | Tragic 14.5% |
| Celtics | 2.8 /100 | #227 | Tragic 14.5% |
| Vietnamese | 2.6 /100 | #228 | Tragic 14.6% |
| Spanish | 2.5 /100 | #229 | Tragic 14.6% |
| Spaniards | 2.3 /100 | #230 | Tragic 14.6% |
Demographics Similar to Slovaks by Female Poverty Among 25-34 Year Olds
In terms of female poverty among 25-34 year olds, the demographic groups most similar to Slovaks are Immigrants from Uruguay (13.7%, a difference of 0.0%), Irish (13.7%, a difference of 0.11%), Immigrants from Eritrea (13.7%, a difference of 0.13%), Finnish (13.7%, a difference of 0.15%), and Czechoslovakian (13.7%, a difference of 0.24%).
| Demographics | Rating | Rank | Female Poverty Among 25-34 Year Olds |
| Germans | 41.6 /100 | #180 | Average 13.6% |
| Guamanians/Chamorros | 41.5 /100 | #181 | Average 13.6% |
| Immigrants | Venezuela | 40.7 /100 | #182 | Average 13.6% |
| Portuguese | 40.3 /100 | #183 | Average 13.6% |
| Czechoslovakians | 36.8 /100 | #184 | Fair 13.7% |
| Irish | 35.3 /100 | #185 | Fair 13.7% |
| Immigrants | Uruguay | 34.1 /100 | #186 | Fair 13.7% |
| Slovaks | 34.1 /100 | #187 | Fair 13.7% |
| Immigrants | Eritrea | 32.7 /100 | #188 | Fair 13.7% |
| Finns | 32.5 /100 | #189 | Fair 13.7% |
| Dutch | 29.7 /100 | #190 | Fair 13.8% |
| Immigrants | St. Vincent and the Grenadines | 29.3 /100 | #191 | Fair 13.8% |
| Tlingit-Haida | 28.1 /100 | #192 | Fair 13.8% |
| Immigrants | Kenya | 28.0 /100 | #193 | Fair 13.8% |
| Moroccans | 25.1 /100 | #194 | Fair 13.8% |