Egyptian vs Vietnamese Seniors Poverty Over the Age of 75
COMPARE
Egyptian
Vietnamese
Seniors Poverty Over the Age of 75
Seniors Poverty Over the Age of 75 Comparison
Egyptians
Vietnamese
12.1%
SENIORS POVERTY OVER THE AGE OF 75
54.8/ 100
METRIC RATING
166th/ 347
METRIC RANK
15.9%
SENIORS POVERTY OVER THE AGE OF 75
0.0/ 100
METRIC RATING
310th/ 347
METRIC RANK
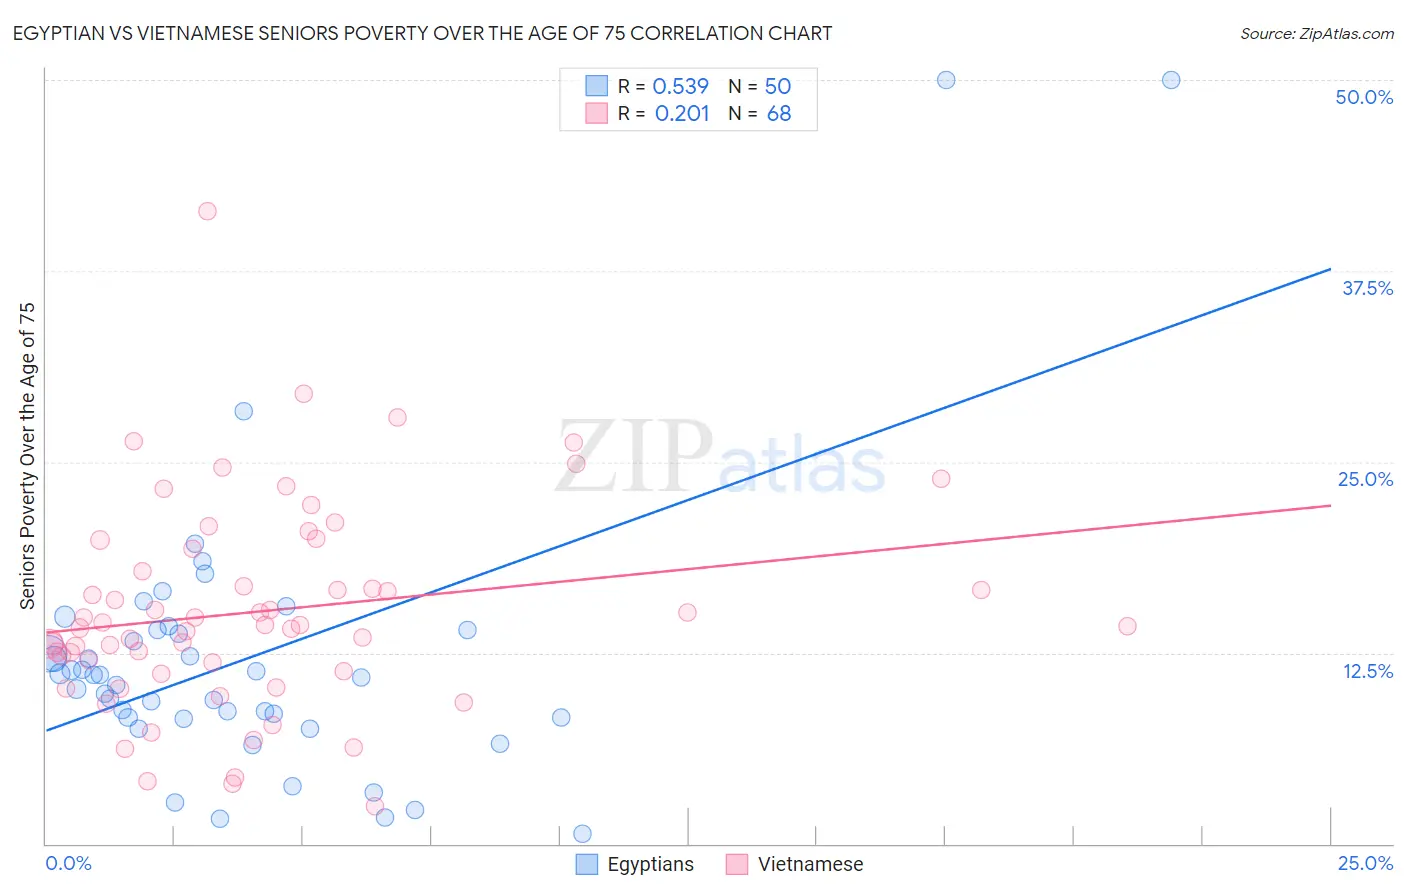
Egyptian vs Vietnamese Seniors Poverty Over the Age of 75 Correlation Chart
The statistical analysis conducted on geographies consisting of 274,710,224 people shows a substantial positive correlation between the proportion of Egyptians and poverty level among seniors over the age of 75 in the United States with a correlation coefficient (R) of 0.539 and weighted average of 12.1%. Similarly, the statistical analysis conducted on geographies consisting of 169,621,093 people shows a weak positive correlation between the proportion of Vietnamese and poverty level among seniors over the age of 75 in the United States with a correlation coefficient (R) of 0.201 and weighted average of 15.9%, a difference of 30.6%.
Seniors Poverty Over the Age of 75 Correlation Summary
| Measurement | Egyptian | Vietnamese |
| Minimum | 0.66% | 2.5% |
| Maximum | 50.0% | 41.4% |
| Range | 49.3% | 38.9% |
| Mean | 12.1% | 15.2% |
| Median | 11.0% | 14.3% |
| Interquartile 25% (IQ1) | 8.3% | 11.5% |
| Interquartile 75% (IQ3) | 14.0% | 18.6% |
| Interquartile Range (IQR) | 5.7% | 7.0% |
| Standard Deviation (Sample) | 9.3% | 6.8% |
| Standard Deviation (Population) | 9.2% | 6.7% |
Similar Demographics by Seniors Poverty Over the Age of 75
Demographics Similar to Egyptians by Seniors Poverty Over the Age of 75
In terms of seniors poverty over the age of 75, the demographic groups most similar to Egyptians are Immigrants from Switzerland (12.1%, a difference of 0.020%), Immigrants from Syria (12.2%, a difference of 0.080%), Immigrants from Egypt (12.2%, a difference of 0.090%), Okinawan (12.1%, a difference of 0.12%), and Potawatomi (12.1%, a difference of 0.21%).
| Demographics | Rating | Rank | Seniors Poverty Over the Age of 75 |
| Immigrants | Middle Africa | 61.2 /100 | #159 | Good 12.1% |
| Immigrants | Eastern Africa | 60.9 /100 | #160 | Good 12.1% |
| Immigrants | Norway | 60.6 /100 | #161 | Good 12.1% |
| Immigrants | Serbia | 60.2 /100 | #162 | Good 12.1% |
| Immigrants | Greece | 58.2 /100 | #163 | Average 12.1% |
| Potawatomi | 57.4 /100 | #164 | Average 12.1% |
| Okinawans | 56.3 /100 | #165 | Average 12.1% |
| Egyptians | 54.8 /100 | #166 | Average 12.1% |
| Immigrants | Switzerland | 54.5 /100 | #167 | Average 12.1% |
| Immigrants | Syria | 53.9 /100 | #168 | Average 12.2% |
| Immigrants | Egypt | 53.7 /100 | #169 | Average 12.2% |
| Immigrants | Thailand | 52.0 /100 | #170 | Average 12.2% |
| Spaniards | 51.6 /100 | #171 | Average 12.2% |
| Immigrants | Fiji | 51.5 /100 | #172 | Average 12.2% |
| Arabs | 50.5 /100 | #173 | Average 12.2% |
Demographics Similar to Vietnamese by Seniors Poverty Over the Age of 75
In terms of seniors poverty over the age of 75, the demographic groups most similar to Vietnamese are Yup'ik (15.8%, a difference of 0.10%), Trinidadian and Tobagonian (15.9%, a difference of 0.10%), Immigrants from Bangladesh (15.8%, a difference of 0.40%), Immigrants from West Indies (15.8%, a difference of 0.44%), and Crow (15.9%, a difference of 0.51%).
| Demographics | Rating | Rank | Seniors Poverty Over the Age of 75 |
| Immigrants | Honduras | 0.0 /100 | #303 | Tragic 15.7% |
| Immigrants | Trinidad and Tobago | 0.0 /100 | #304 | Tragic 15.7% |
| Ecuadorians | 0.0 /100 | #305 | Tragic 15.7% |
| Hispanics or Latinos | 0.0 /100 | #306 | Tragic 15.8% |
| Immigrants | West Indies | 0.0 /100 | #307 | Tragic 15.8% |
| Immigrants | Bangladesh | 0.0 /100 | #308 | Tragic 15.8% |
| Yup'ik | 0.0 /100 | #309 | Tragic 15.8% |
| Vietnamese | 0.0 /100 | #310 | Tragic 15.9% |
| Trinidadians and Tobagonians | 0.0 /100 | #311 | Tragic 15.9% |
| Crow | 0.0 /100 | #312 | Tragic 15.9% |
| Barbadians | 0.0 /100 | #313 | Tragic 16.0% |
| Tsimshian | 0.0 /100 | #314 | Tragic 16.1% |
| Guyanese | 0.0 /100 | #315 | Tragic 16.1% |
| Immigrants | Ecuador | 0.0 /100 | #316 | Tragic 16.1% |
| Immigrants | Guyana | 0.0 /100 | #317 | Tragic 16.2% |