Mexican vs Kiowa Female Poverty Among 18-24 Year Olds
COMPARE
Mexican
Kiowa
Female Poverty Among 18-24 Year Olds
Female Poverty Among 18-24 Year Olds Comparison
Mexicans
Kiowa
20.5%
FEMALE POVERTY AMONG 18-24 YEAR OLDS
18.3/ 100
METRIC RATING
201st/ 347
METRIC RANK
29.2%
FEMALE POVERTY AMONG 18-24 YEAR OLDS
0.0/ 100
METRIC RATING
342nd/ 347
METRIC RANK
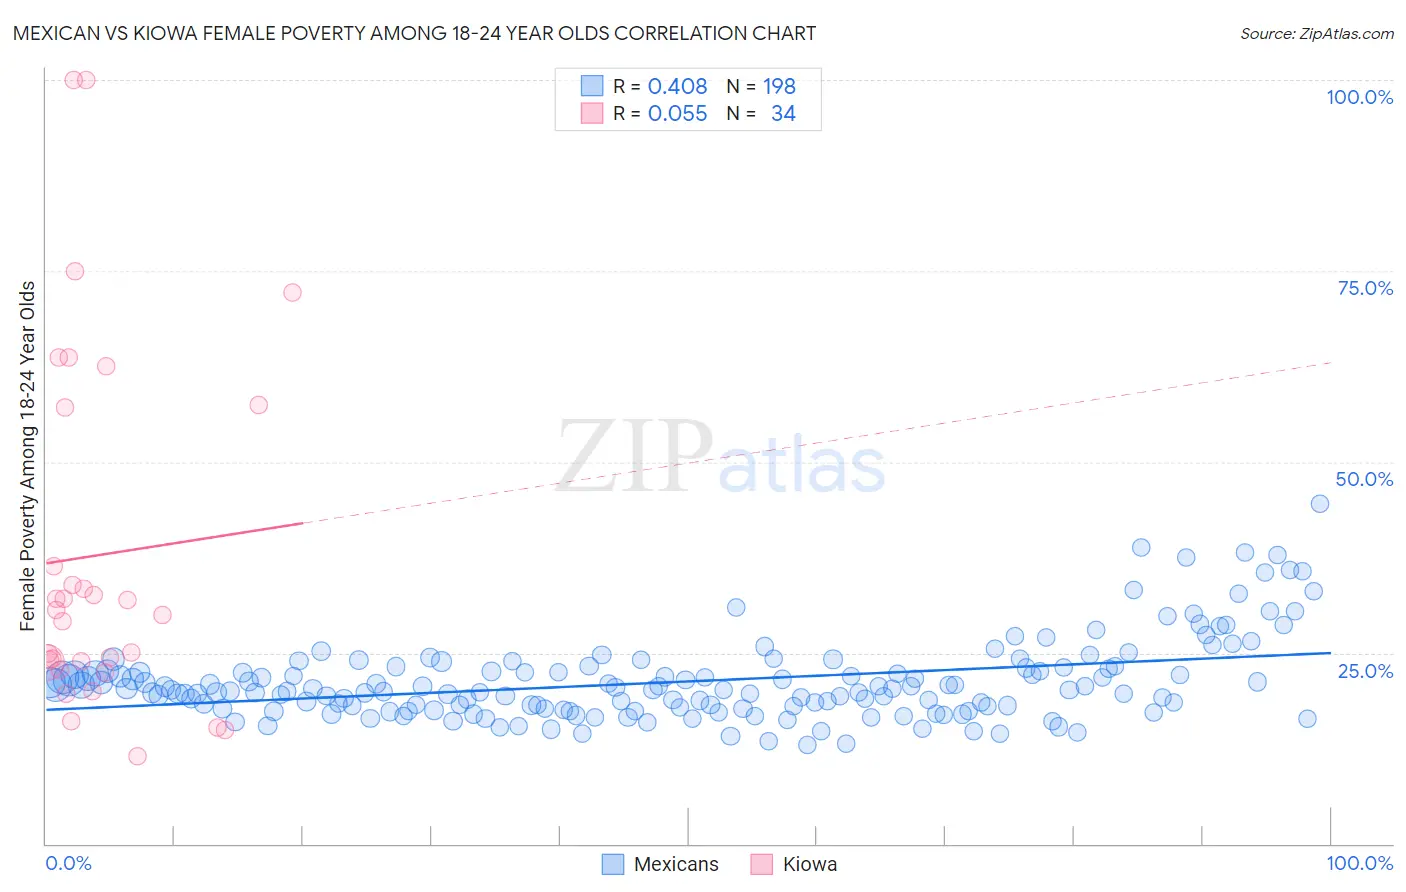
Mexican vs Kiowa Female Poverty Among 18-24 Year Olds Correlation Chart
The statistical analysis conducted on geographies consisting of 535,224,564 people shows a moderate positive correlation between the proportion of Mexicans and poverty level among females between the ages 18 and 24 in the United States with a correlation coefficient (R) of 0.408 and weighted average of 20.5%. Similarly, the statistical analysis conducted on geographies consisting of 55,937,345 people shows a slight positive correlation between the proportion of Kiowa and poverty level among females between the ages 18 and 24 in the United States with a correlation coefficient (R) of 0.055 and weighted average of 29.2%, a difference of 42.8%.
Female Poverty Among 18-24 Year Olds Correlation Summary
| Measurement | Mexican | Kiowa |
| Minimum | 12.9% | 11.5% |
| Maximum | 44.4% | 100.0% |
| Range | 31.6% | 88.5% |
| Mean | 21.2% | 37.8% |
| Median | 20.1% | 30.3% |
| Interquartile 25% (IQ1) | 17.8% | 23.8% |
| Interquartile 75% (IQ3) | 22.6% | 57.1% |
| Interquartile Range (IQR) | 4.7% | 33.3% |
| Standard Deviation (Sample) | 5.2% | 23.3% |
| Standard Deviation (Population) | 5.2% | 23.0% |
Similar Demographics by Female Poverty Among 18-24 Year Olds
Demographics Similar to Mexicans by Female Poverty Among 18-24 Year Olds
In terms of female poverty among 18-24 year olds, the demographic groups most similar to Mexicans are Immigrants from Turkey (20.5%, a difference of 0.050%), Immigrants from Malaysia (20.5%, a difference of 0.090%), Immigrants from Netherlands (20.5%, a difference of 0.11%), European (20.4%, a difference of 0.13%), and English (20.5%, a difference of 0.13%).
| Demographics | Rating | Rank | Female Poverty Among 18-24 Year Olds |
| Mexican American Indians | 23.2 /100 | #194 | Fair 20.4% |
| Immigrants | Latvia | 23.0 /100 | #195 | Fair 20.4% |
| Czechs | 22.3 /100 | #196 | Fair 20.4% |
| Zimbabweans | 21.0 /100 | #197 | Fair 20.4% |
| Immigrants | Spain | 20.7 /100 | #198 | Fair 20.4% |
| Germans | 20.6 /100 | #199 | Fair 20.4% |
| Europeans | 19.9 /100 | #200 | Poor 20.4% |
| Mexicans | 18.3 /100 | #201 | Poor 20.5% |
| Immigrants | Turkey | 17.7 /100 | #202 | Poor 20.5% |
| Immigrants | Malaysia | 17.2 /100 | #203 | Poor 20.5% |
| Immigrants | Netherlands | 17.0 /100 | #204 | Poor 20.5% |
| English | 16.7 /100 | #205 | Poor 20.5% |
| Hispanics or Latinos | 16.6 /100 | #206 | Poor 20.5% |
| Spaniards | 16.3 /100 | #207 | Poor 20.5% |
| Dutch | 15.9 /100 | #208 | Poor 20.5% |
Demographics Similar to Kiowa by Female Poverty Among 18-24 Year Olds
In terms of female poverty among 18-24 year olds, the demographic groups most similar to Kiowa are Colville (29.0%, a difference of 0.74%), Puerto Rican (29.8%, a difference of 2.1%), Sioux (28.6%, a difference of 2.3%), Pima (28.4%, a difference of 2.9%), and Hopi (28.2%, a difference of 3.6%).
| Demographics | Rating | Rank | Female Poverty Among 18-24 Year Olds |
| Apache | 0.0 /100 | #333 | Tragic 26.3% |
| Pueblo | 0.0 /100 | #334 | Tragic 26.9% |
| Yup'ik | 0.0 /100 | #335 | Tragic 27.0% |
| Immigrants | Yemen | 0.0 /100 | #336 | Tragic 27.5% |
| Cheyenne | 0.0 /100 | #337 | Tragic 28.1% |
| Hopi | 0.0 /100 | #338 | Tragic 28.2% |
| Pima | 0.0 /100 | #339 | Tragic 28.4% |
| Sioux | 0.0 /100 | #340 | Tragic 28.6% |
| Colville | 0.0 /100 | #341 | Tragic 29.0% |
| Kiowa | 0.0 /100 | #342 | Tragic 29.2% |
| Puerto Ricans | 0.0 /100 | #343 | Tragic 29.8% |
| Navajo | 0.0 /100 | #344 | Tragic 30.3% |
| Tohono O'odham | 0.0 /100 | #345 | Tragic 31.0% |
| Lumbee | 0.0 /100 | #346 | Tragic 31.1% |
| Crow | 0.0 /100 | #347 | Tragic 33.2% |