Mexican American Indian vs Luxembourger Female Poverty Among 25-34 Year Olds
COMPARE
Mexican American Indian
Luxembourger
Female Poverty Among 25-34 Year Olds
Female Poverty Among 25-34 Year Olds Comparison
Mexican American Indians
Luxembourgers
15.4%
FEMALE POVERTY AMONG 25-34 YEAR OLDS
0.2/ 100
METRIC RATING
263rd/ 347
METRIC RANK
12.1%
FEMALE POVERTY AMONG 25-34 YEAR OLDS
99.5/ 100
METRIC RATING
56th/ 347
METRIC RANK
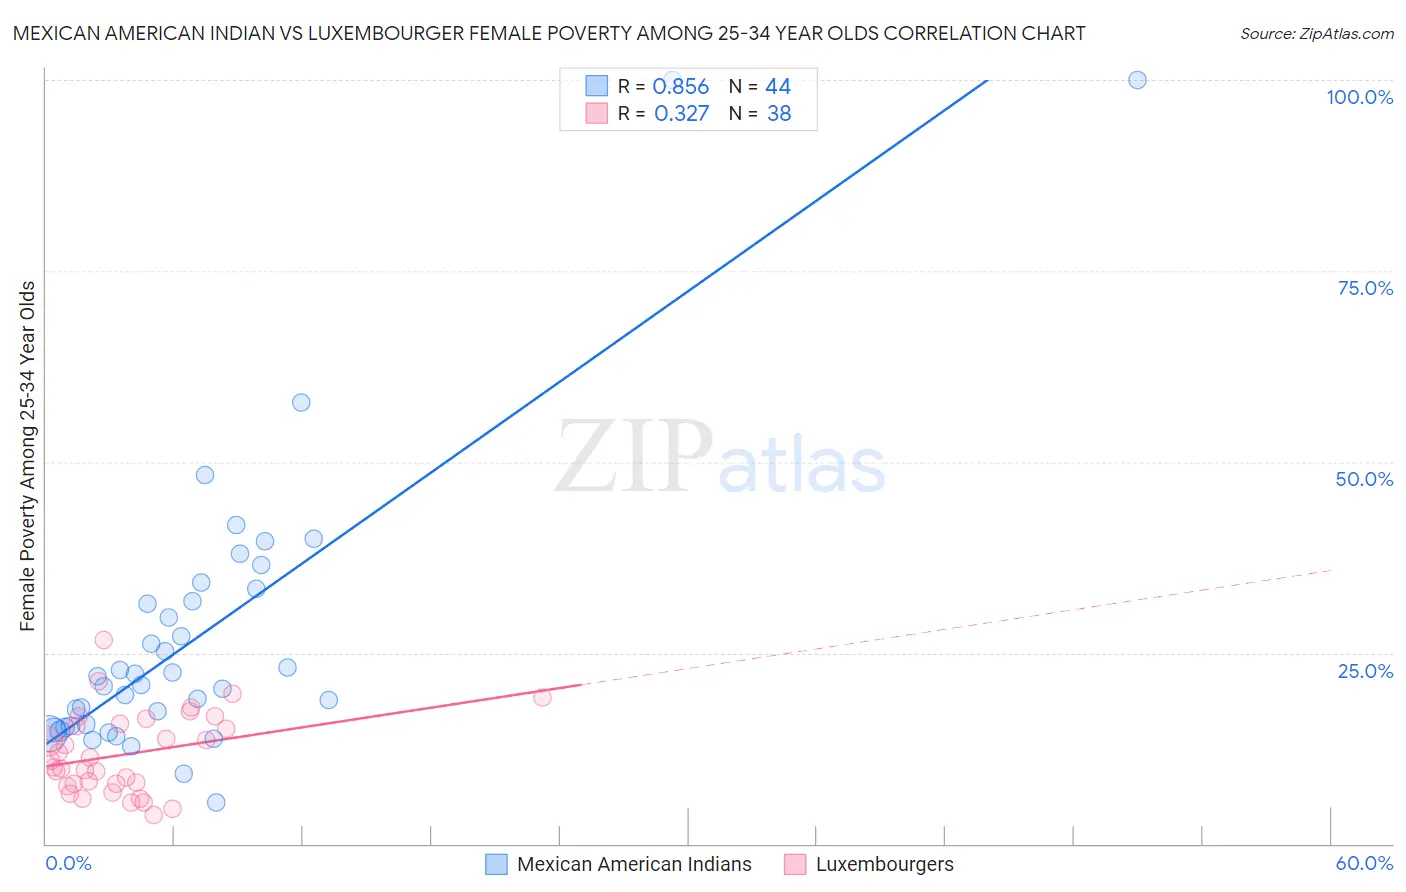
Mexican American Indian vs Luxembourger Female Poverty Among 25-34 Year Olds Correlation Chart
The statistical analysis conducted on geographies consisting of 315,662,807 people shows a very strong positive correlation between the proportion of Mexican American Indians and poverty level among females between the ages 25 and 34 in the United States with a correlation coefficient (R) of 0.856 and weighted average of 15.4%. Similarly, the statistical analysis conducted on geographies consisting of 143,147,078 people shows a mild positive correlation between the proportion of Luxembourgers and poverty level among females between the ages 25 and 34 in the United States with a correlation coefficient (R) of 0.327 and weighted average of 12.1%, a difference of 27.2%.
Female Poverty Among 25-34 Year Olds Correlation Summary
| Measurement | Mexican American Indian | Luxembourger |
| Minimum | 5.3% | 3.7% |
| Maximum | 100.0% | 26.7% |
| Range | 94.7% | 23.0% |
| Mean | 27.2% | 11.8% |
| Median | 21.4% | 10.5% |
| Interquartile 25% (IQ1) | 15.4% | 7.8% |
| Interquartile 75% (IQ3) | 32.6% | 15.8% |
| Interquartile Range (IQR) | 17.2% | 8.0% |
| Standard Deviation (Sample) | 19.4% | 5.3% |
| Standard Deviation (Population) | 19.2% | 5.2% |
Similar Demographics by Female Poverty Among 25-34 Year Olds
Demographics Similar to Mexican American Indians by Female Poverty Among 25-34 Year Olds
In terms of female poverty among 25-34 year olds, the demographic groups most similar to Mexican American Indians are Immigrants from Belize (15.3%, a difference of 0.24%), Liberian (15.3%, a difference of 0.28%), Pennsylvania German (15.4%, a difference of 0.43%), Immigrants from Liberia (15.4%, a difference of 0.47%), and Immigrants from Somalia (15.4%, a difference of 0.48%).
| Demographics | Rating | Rank | Female Poverty Among 25-34 Year Olds |
| West Indians | 0.3 /100 | #256 | Tragic 15.2% |
| Immigrants | Burma/Myanmar | 0.3 /100 | #257 | Tragic 15.2% |
| Nepalese | 0.2 /100 | #258 | Tragic 15.2% |
| Immigrants | Cuba | 0.2 /100 | #259 | Tragic 15.2% |
| Marshallese | 0.2 /100 | #260 | Tragic 15.3% |
| Liberians | 0.2 /100 | #261 | Tragic 15.3% |
| Immigrants | Belize | 0.2 /100 | #262 | Tragic 15.3% |
| Mexican American Indians | 0.2 /100 | #263 | Tragic 15.4% |
| Pennsylvania Germans | 0.1 /100 | #264 | Tragic 15.4% |
| Immigrants | Liberia | 0.1 /100 | #265 | Tragic 15.4% |
| Immigrants | Somalia | 0.1 /100 | #266 | Tragic 15.4% |
| Central Americans | 0.1 /100 | #267 | Tragic 15.5% |
| Immigrants | Senegal | 0.1 /100 | #268 | Tragic 15.6% |
| Sub-Saharan Africans | 0.1 /100 | #269 | Tragic 15.6% |
| British West Indians | 0.1 /100 | #270 | Tragic 15.6% |
Demographics Similar to Luxembourgers by Female Poverty Among 25-34 Year Olds
In terms of female poverty among 25-34 year olds, the demographic groups most similar to Luxembourgers are Jordanian (12.1%, a difference of 0.020%), Immigrants from Romania (12.1%, a difference of 0.22%), Russian (12.1%, a difference of 0.23%), Immigrants from Northern Europe (12.1%, a difference of 0.31%), and Immigrants from Philippines (12.0%, a difference of 0.33%).
| Demographics | Rating | Rank | Female Poverty Among 25-34 Year Olds |
| Immigrants | Egypt | 99.6 /100 | #49 | Exceptional 12.0% |
| Immigrants | Croatia | 99.6 /100 | #50 | Exceptional 12.0% |
| Paraguayans | 99.6 /100 | #51 | Exceptional 12.0% |
| Immigrants | Eastern Europe | 99.6 /100 | #52 | Exceptional 12.0% |
| Immigrants | Israel | 99.6 /100 | #53 | Exceptional 12.0% |
| Eastern Europeans | 99.6 /100 | #54 | Exceptional 12.0% |
| Immigrants | Philippines | 99.5 /100 | #55 | Exceptional 12.0% |
| Luxembourgers | 99.5 /100 | #56 | Exceptional 12.1% |
| Jordanians | 99.4 /100 | #57 | Exceptional 12.1% |
| Immigrants | Romania | 99.4 /100 | #58 | Exceptional 12.1% |
| Russians | 99.4 /100 | #59 | Exceptional 12.1% |
| Immigrants | Northern Europe | 99.4 /100 | #60 | Exceptional 12.1% |
| Immigrants | Czechoslovakia | 99.4 /100 | #61 | Exceptional 12.1% |
| Immigrants | Moldova | 99.3 /100 | #62 | Exceptional 12.1% |
| Soviet Union | 99.3 /100 | #63 | Exceptional 12.1% |