Serbian vs Cajun Child Poverty Among Boys Under 16
COMPARE
Serbian
Cajun
Child Poverty Among Boys Under 16
Child Poverty Among Boys Under 16 Comparison
Serbians
Cajuns
15.1%
CHILD POVERTY AMONG BOYS UNDER 16
95.2/ 100
METRIC RATING
106th/ 347
METRIC RANK
22.2%
CHILD POVERTY AMONG BOYS UNDER 16
0.0/ 100
METRIC RATING
321st/ 347
METRIC RANK
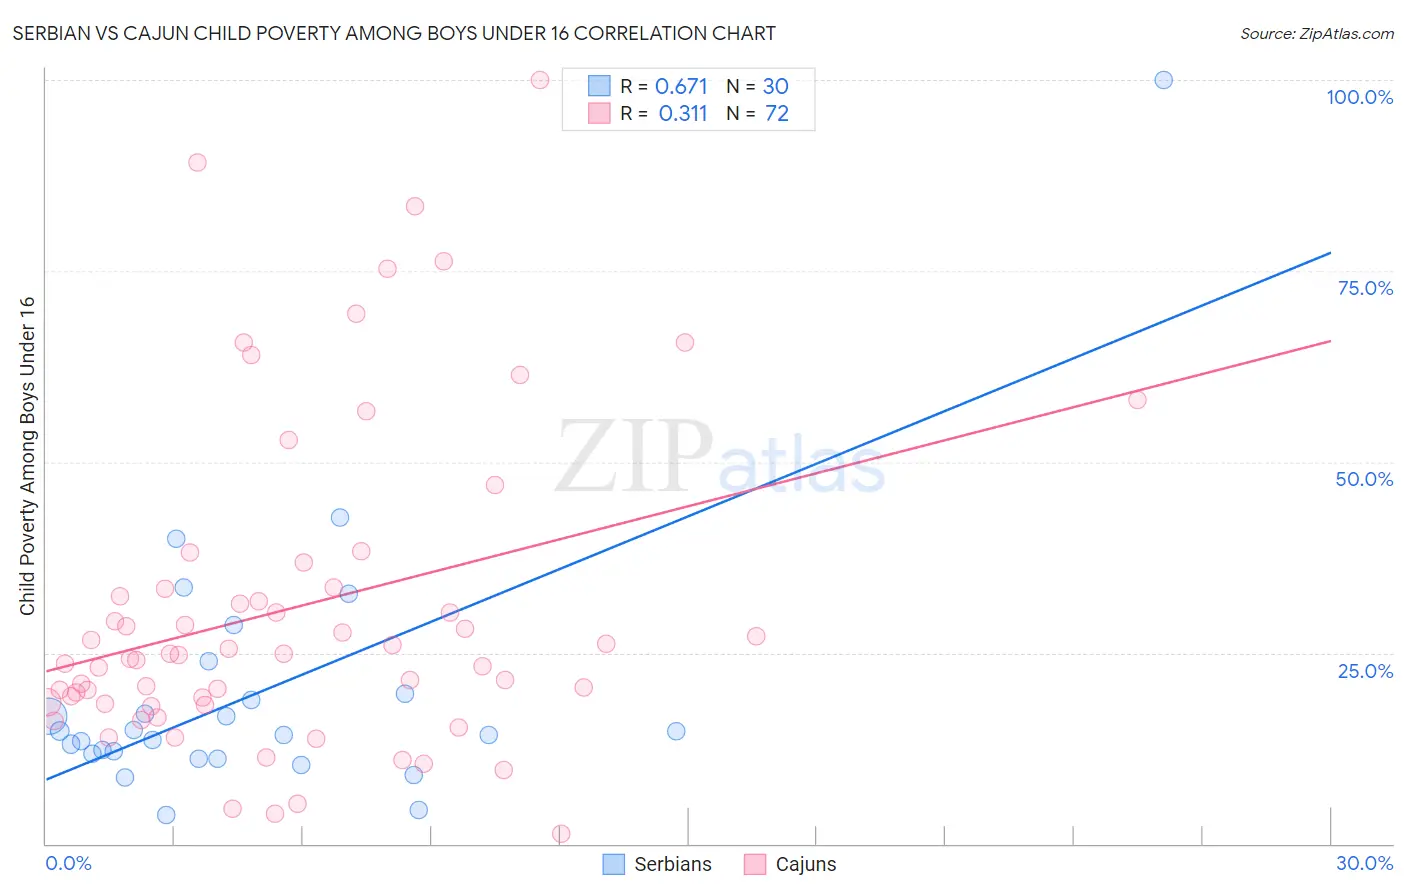
Serbian vs Cajun Child Poverty Among Boys Under 16 Correlation Chart
The statistical analysis conducted on geographies consisting of 263,748,099 people shows a significant positive correlation between the proportion of Serbians and poverty level among boys under the age of 16 in the United States with a correlation coefficient (R) of 0.671 and weighted average of 15.1%. Similarly, the statistical analysis conducted on geographies consisting of 148,584,724 people shows a mild positive correlation between the proportion of Cajuns and poverty level among boys under the age of 16 in the United States with a correlation coefficient (R) of 0.311 and weighted average of 22.2%, a difference of 47.4%.
Child Poverty Among Boys Under 16 Correlation Summary
| Measurement | Serbian | Cajun |
| Minimum | 3.7% | 1.3% |
| Maximum | 100.0% | 100.0% |
| Range | 96.3% | 98.7% |
| Mean | 19.9% | 30.9% |
| Median | 14.5% | 24.8% |
| Interquartile 25% (IQ1) | 11.8% | 18.5% |
| Interquartile 75% (IQ3) | 19.6% | 33.5% |
| Interquartile Range (IQR) | 7.9% | 15.0% |
| Standard Deviation (Sample) | 17.9% | 21.2% |
| Standard Deviation (Population) | 17.6% | 21.1% |
Similar Demographics by Child Poverty Among Boys Under 16
Demographics Similar to Serbians by Child Poverty Among Boys Under 16
In terms of child poverty among boys under 16, the demographic groups most similar to Serbians are Jordanian (15.1%, a difference of 0.11%), Dutch (15.0%, a difference of 0.12%), Immigrants from Switzerland (15.0%, a difference of 0.13%), Immigrants from Denmark (15.0%, a difference of 0.23%), and Romanian (15.0%, a difference of 0.27%).
| Demographics | Rating | Rank | Child Poverty Among Boys Under 16 |
| Immigrants | France | 96.1 /100 | #99 | Exceptional 15.0% |
| Chileans | 95.8 /100 | #100 | Exceptional 15.0% |
| Immigrants | Belarus | 95.7 /100 | #101 | Exceptional 15.0% |
| Romanians | 95.6 /100 | #102 | Exceptional 15.0% |
| Immigrants | Denmark | 95.6 /100 | #103 | Exceptional 15.0% |
| Immigrants | Switzerland | 95.4 /100 | #104 | Exceptional 15.0% |
| Dutch | 95.4 /100 | #105 | Exceptional 15.0% |
| Serbians | 95.2 /100 | #106 | Exceptional 15.1% |
| Jordanians | 95.1 /100 | #107 | Exceptional 15.1% |
| Immigrants | England | 94.8 /100 | #108 | Exceptional 15.1% |
| Pakistanis | 94.7 /100 | #109 | Exceptional 15.1% |
| English | 94.3 /100 | #110 | Exceptional 15.1% |
| Immigrants | Zimbabwe | 94.2 /100 | #111 | Exceptional 15.2% |
| Basques | 93.8 /100 | #112 | Exceptional 15.2% |
| Irish | 93.8 /100 | #113 | Exceptional 15.2% |
Demographics Similar to Cajuns by Child Poverty Among Boys Under 16
In terms of child poverty among boys under 16, the demographic groups most similar to Cajuns are Immigrants from Dominica (22.2%, a difference of 0.020%), Honduran (22.3%, a difference of 0.56%), U.S. Virgin Islander (22.0%, a difference of 0.90%), Immigrants from Congo (22.4%, a difference of 0.93%), and Central American Indian (22.5%, a difference of 1.4%).
| Demographics | Rating | Rank | Child Poverty Among Boys Under 16 |
| Ute | 0.0 /100 | #314 | Tragic 21.6% |
| Immigrants | Somalia | 0.0 /100 | #315 | Tragic 21.7% |
| Menominee | 0.0 /100 | #316 | Tragic 21.7% |
| Africans | 0.0 /100 | #317 | Tragic 21.7% |
| Yakama | 0.0 /100 | #318 | Tragic 21.7% |
| Dutch West Indians | 0.0 /100 | #319 | Tragic 21.8% |
| U.S. Virgin Islanders | 0.0 /100 | #320 | Tragic 22.0% |
| Cajuns | 0.0 /100 | #321 | Tragic 22.2% |
| Immigrants | Dominica | 0.0 /100 | #322 | Tragic 22.2% |
| Hondurans | 0.0 /100 | #323 | Tragic 22.3% |
| Immigrants | Congo | 0.0 /100 | #324 | Tragic 22.4% |
| Central American Indians | 0.0 /100 | #325 | Tragic 22.5% |
| Paiute | 0.0 /100 | #326 | Tragic 22.8% |
| Immigrants | Honduras | 0.0 /100 | #327 | Tragic 22.8% |
| Pueblo | 0.0 /100 | #328 | Tragic 23.5% |