Mexican American Indian vs Cajun In Labor Force | Age 45-54
COMPARE
Mexican American Indian
Cajun
In Labor Force | Age 45-54
In Labor Force | Age 45-54 Comparison
Mexican American Indians
Cajuns
80.7%
IN LABOR FORCE | AGE 45-54
0.0/ 100
METRIC RATING
290th/ 347
METRIC RANK
78.1%
IN LABOR FORCE | AGE 45-54
0.0/ 100
METRIC RATING
327th/ 347
METRIC RANK
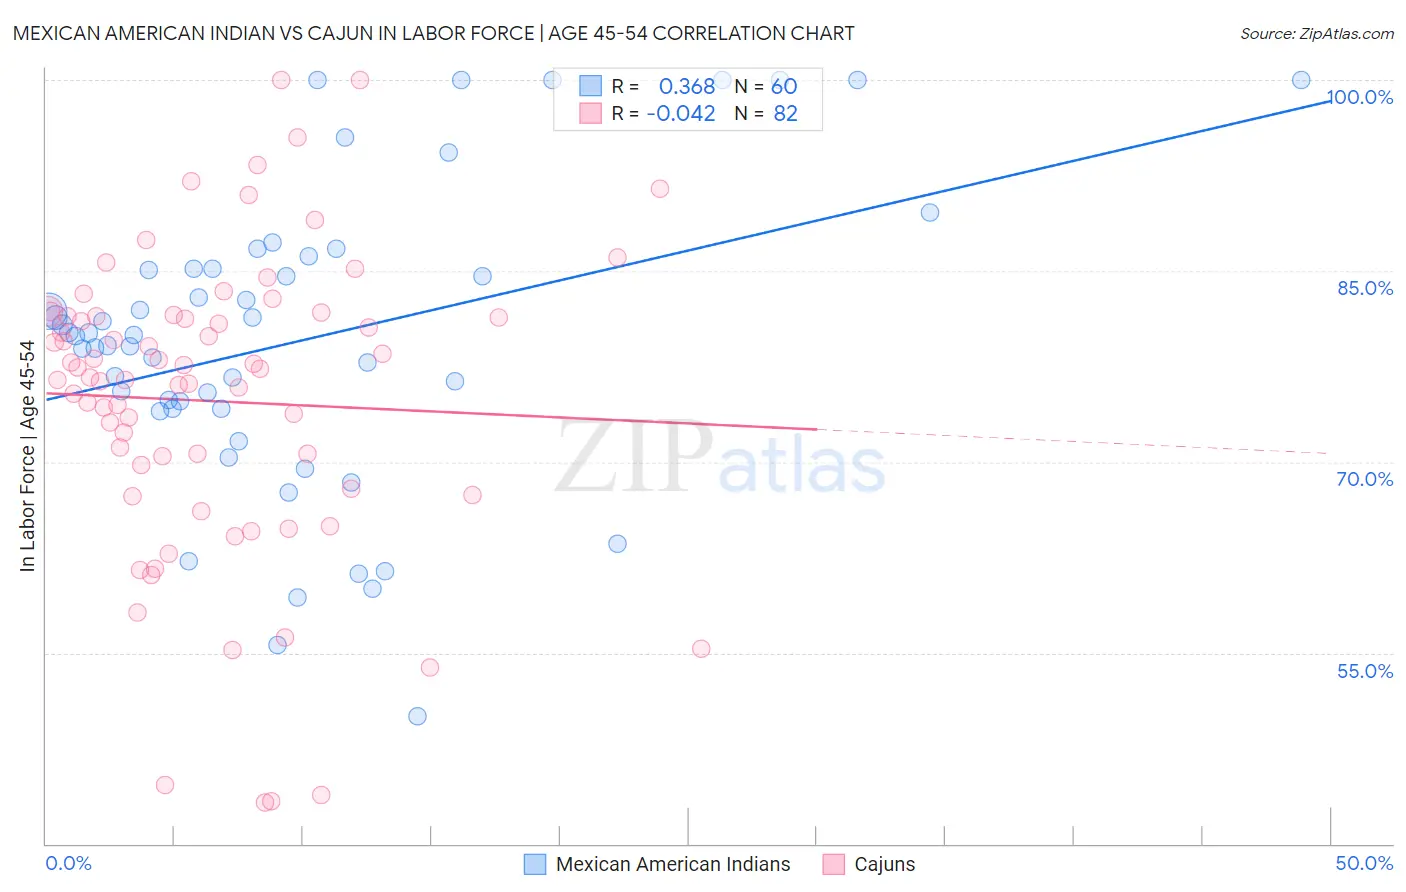
Mexican American Indian vs Cajun In Labor Force | Age 45-54 Correlation Chart
The statistical analysis conducted on geographies consisting of 317,497,854 people shows a mild positive correlation between the proportion of Mexican American Indians and labor force participation rate among population between the ages 45 and 54 in the United States with a correlation coefficient (R) of 0.368 and weighted average of 80.7%. Similarly, the statistical analysis conducted on geographies consisting of 149,692,418 people shows no correlation between the proportion of Cajuns and labor force participation rate among population between the ages 45 and 54 in the United States with a correlation coefficient (R) of -0.042 and weighted average of 78.1%, a difference of 3.3%.
In Labor Force | Age 45-54 Correlation Summary
| Measurement | Mexican American Indian | Cajun |
| Minimum | 50.0% | 43.2% |
| Maximum | 100.0% | 100.0% |
| Range | 50.0% | 56.8% |
| Mean | 79.5% | 74.8% |
| Median | 80.0% | 76.9% |
| Interquartile 25% (IQ1) | 74.2% | 67.9% |
| Interquartile 75% (IQ3) | 85.1% | 81.5% |
| Interquartile Range (IQR) | 11.0% | 13.6% |
| Standard Deviation (Sample) | 11.7% | 12.0% |
| Standard Deviation (Population) | 11.6% | 12.0% |
Similar Demographics by In Labor Force | Age 45-54
Demographics Similar to Mexican American Indians by In Labor Force | Age 45-54
In terms of in labor force | age 45-54, the demographic groups most similar to Mexican American Indians are Immigrants from Bangladesh (80.7%, a difference of 0.030%), Cree (80.8%, a difference of 0.060%), Delaware (80.8%, a difference of 0.070%), Immigrants from Dominica (80.8%, a difference of 0.070%), and Vietnamese (80.8%, a difference of 0.070%).
| Demographics | Rating | Rank | In Labor Force | Age 45-54 |
| French American Indians | 0.0 /100 | #283 | Tragic 80.8% |
| Belizeans | 0.0 /100 | #284 | Tragic 80.8% |
| Delaware | 0.0 /100 | #285 | Tragic 80.8% |
| Immigrants | Dominica | 0.0 /100 | #286 | Tragic 80.8% |
| Vietnamese | 0.0 /100 | #287 | Tragic 80.8% |
| Cree | 0.0 /100 | #288 | Tragic 80.8% |
| Immigrants | Bangladesh | 0.0 /100 | #289 | Tragic 80.7% |
| Mexican American Indians | 0.0 /100 | #290 | Tragic 80.7% |
| Immigrants | Belize | 0.0 /100 | #291 | Tragic 80.6% |
| Iroquois | 0.0 /100 | #292 | Tragic 80.6% |
| Osage | 0.0 /100 | #293 | Tragic 80.6% |
| Yakama | 0.0 /100 | #294 | Tragic 80.6% |
| Nepalese | 0.0 /100 | #295 | Tragic 80.5% |
| Africans | 0.0 /100 | #296 | Tragic 80.5% |
| Americans | 0.0 /100 | #297 | Tragic 80.4% |
Demographics Similar to Cajuns by In Labor Force | Age 45-54
In terms of in labor force | age 45-54, the demographic groups most similar to Cajuns are Seminole (78.1%, a difference of 0.0%), Choctaw (78.2%, a difference of 0.050%), Dutch West Indian (78.2%, a difference of 0.15%), Kiowa (78.3%, a difference of 0.16%), and Sioux (78.0%, a difference of 0.22%).
| Demographics | Rating | Rank | In Labor Force | Age 45-54 |
| Yaqui | 0.0 /100 | #320 | Tragic 78.9% |
| Yup'ik | 0.0 /100 | #321 | Tragic 78.6% |
| Crow | 0.0 /100 | #322 | Tragic 78.3% |
| Kiowa | 0.0 /100 | #323 | Tragic 78.3% |
| Dutch West Indians | 0.0 /100 | #324 | Tragic 78.2% |
| Choctaw | 0.0 /100 | #325 | Tragic 78.2% |
| Seminole | 0.0 /100 | #326 | Tragic 78.1% |
| Cajuns | 0.0 /100 | #327 | Tragic 78.1% |
| Sioux | 0.0 /100 | #328 | Tragic 78.0% |
| Creek | 0.0 /100 | #329 | Tragic 77.7% |
| Cheyenne | 0.0 /100 | #330 | Tragic 77.6% |
| Tsimshian | 0.0 /100 | #331 | Tragic 77.4% |
| Menominee | 0.0 /100 | #332 | Tragic 77.4% |
| Natives/Alaskans | 0.0 /100 | #333 | Tragic 77.1% |
| Apache | 0.0 /100 | #334 | Tragic 77.1% |