Sri Lankan vs Immigrants from England Child Poverty Under the Age of 16
COMPARE
Sri Lankan
Immigrants from England
Child Poverty Under the Age of 16
Child Poverty Under the Age of 16 Comparison
Sri Lankans
Immigrants from England
14.9%
CHILD POVERTY UNDER THE AGE OF 16
93.2/ 100
METRIC RATING
114th/ 347
METRIC RANK
14.8%
CHILD POVERTY UNDER THE AGE OF 16
94.8/ 100
METRIC RATING
104th/ 347
METRIC RANK
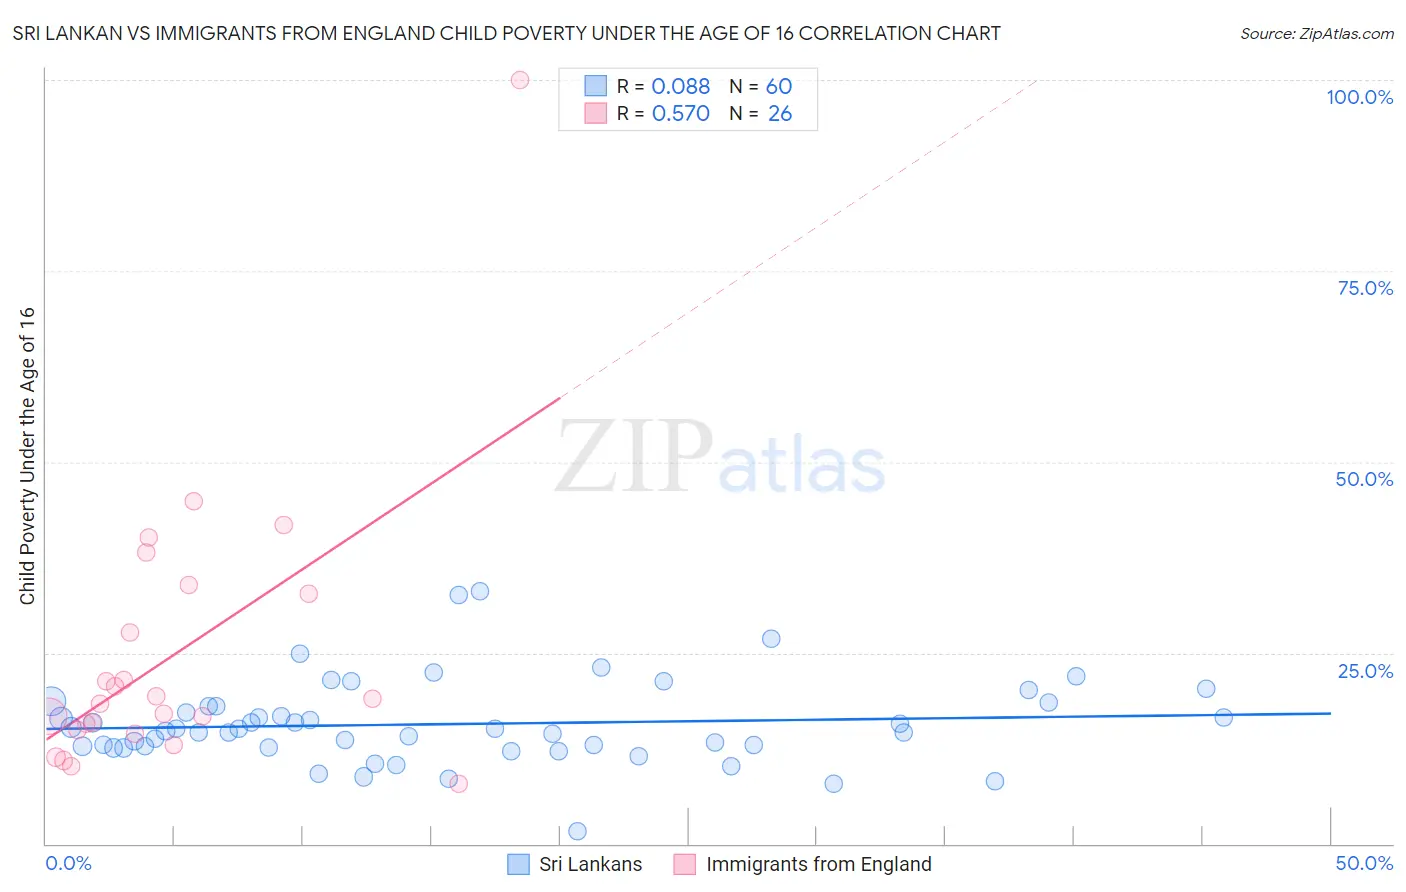
Sri Lankan vs Immigrants from England Child Poverty Under the Age of 16 Correlation Chart
The statistical analysis conducted on geographies consisting of 436,349,491 people shows a slight positive correlation between the proportion of Sri Lankans and poverty level among children under the age of 16 in the United States with a correlation coefficient (R) of 0.088 and weighted average of 14.9%. Similarly, the statistical analysis conducted on geographies consisting of 387,672,551 people shows a substantial positive correlation between the proportion of Immigrants from England and poverty level among children under the age of 16 in the United States with a correlation coefficient (R) of 0.570 and weighted average of 14.8%, a difference of 0.95%.
Child Poverty Under the Age of 16 Correlation Summary
| Measurement | Sri Lankan | Immigrants from England |
| Minimum | 1.7% | 7.8% |
| Maximum | 33.1% | 100.0% |
| Range | 31.4% | 92.2% |
| Mean | 15.7% | 24.7% |
| Median | 14.9% | 18.6% |
| Interquartile 25% (IQ1) | 12.7% | 14.9% |
| Interquartile 75% (IQ3) | 18.0% | 32.7% |
| Interquartile Range (IQR) | 5.3% | 17.8% |
| Standard Deviation (Sample) | 5.5% | 18.6% |
| Standard Deviation (Population) | 5.5% | 18.2% |
Demographics Similar to Sri Lankans and Immigrants from England by Child Poverty Under the Age of 16
In terms of child poverty under the age of 16, the demographic groups most similar to Sri Lankans are Belgian (14.9%, a difference of 0.030%), Immigrants from Ukraine (14.9%, a difference of 0.060%), Irish (14.9%, a difference of 0.070%), Carpatho Rusyn (14.9%, a difference of 0.080%), and Immigrants from Denmark (14.9%, a difference of 0.13%). Similarly, the demographic groups most similar to Immigrants from England are Immigrants from Egypt (14.8%, a difference of 0.040%), Romanian (14.8%, a difference of 0.090%), Basque (14.8%, a difference of 0.11%), Immigrants from Switzerland (14.8%, a difference of 0.16%), and Dutch (14.8%, a difference of 0.17%).
| Demographics | Rating | Rank | Child Poverty Under the Age of 16 |
| British | 95.5 /100 | #99 | Exceptional 14.7% |
| Dutch | 95.1 /100 | #100 | Exceptional 14.8% |
| Immigrants | Switzerland | 95.1 /100 | #101 | Exceptional 14.8% |
| Romanians | 95.0 /100 | #102 | Exceptional 14.8% |
| Immigrants | Egypt | 94.9 /100 | #103 | Exceptional 14.8% |
| Immigrants | England | 94.8 /100 | #104 | Exceptional 14.8% |
| Basques | 94.7 /100 | #105 | Exceptional 14.8% |
| Serbians | 94.5 /100 | #106 | Exceptional 14.8% |
| Chileans | 94.4 /100 | #107 | Exceptional 14.8% |
| Jordanians | 94.2 /100 | #108 | Exceptional 14.8% |
| Tlingit-Haida | 94.1 /100 | #109 | Exceptional 14.9% |
| English | 93.5 /100 | #110 | Exceptional 14.9% |
| Immigrants | Denmark | 93.5 /100 | #111 | Exceptional 14.9% |
| Irish | 93.4 /100 | #112 | Exceptional 14.9% |
| Belgians | 93.3 /100 | #113 | Exceptional 14.9% |
| Sri Lankans | 93.2 /100 | #114 | Exceptional 14.9% |
| Immigrants | Ukraine | 93.1 /100 | #115 | Exceptional 14.9% |
| Carpatho Rusyns | 93.1 /100 | #116 | Exceptional 14.9% |
| Immigrants | Norway | 92.8 /100 | #117 | Exceptional 15.0% |
| Immigrants | Malaysia | 92.6 /100 | #118 | Exceptional 15.0% |
| Scottish | 92.3 /100 | #119 | Exceptional 15.0% |