Immigrants from Croatia vs Brazilian Female Poverty Among 25-34 Year Olds
COMPARE
Immigrants from Croatia
Brazilian
Female Poverty Among 25-34 Year Olds
Female Poverty Among 25-34 Year Olds Comparison
Immigrants from Croatia
Brazilians
12.0%
FEMALE POVERTY AMONG 25-34 YEAR OLDS
99.6/ 100
METRIC RATING
50th/ 347
METRIC RANK
13.1%
FEMALE POVERTY AMONG 25-34 YEAR OLDS
84.5/ 100
METRIC RATING
138th/ 347
METRIC RANK
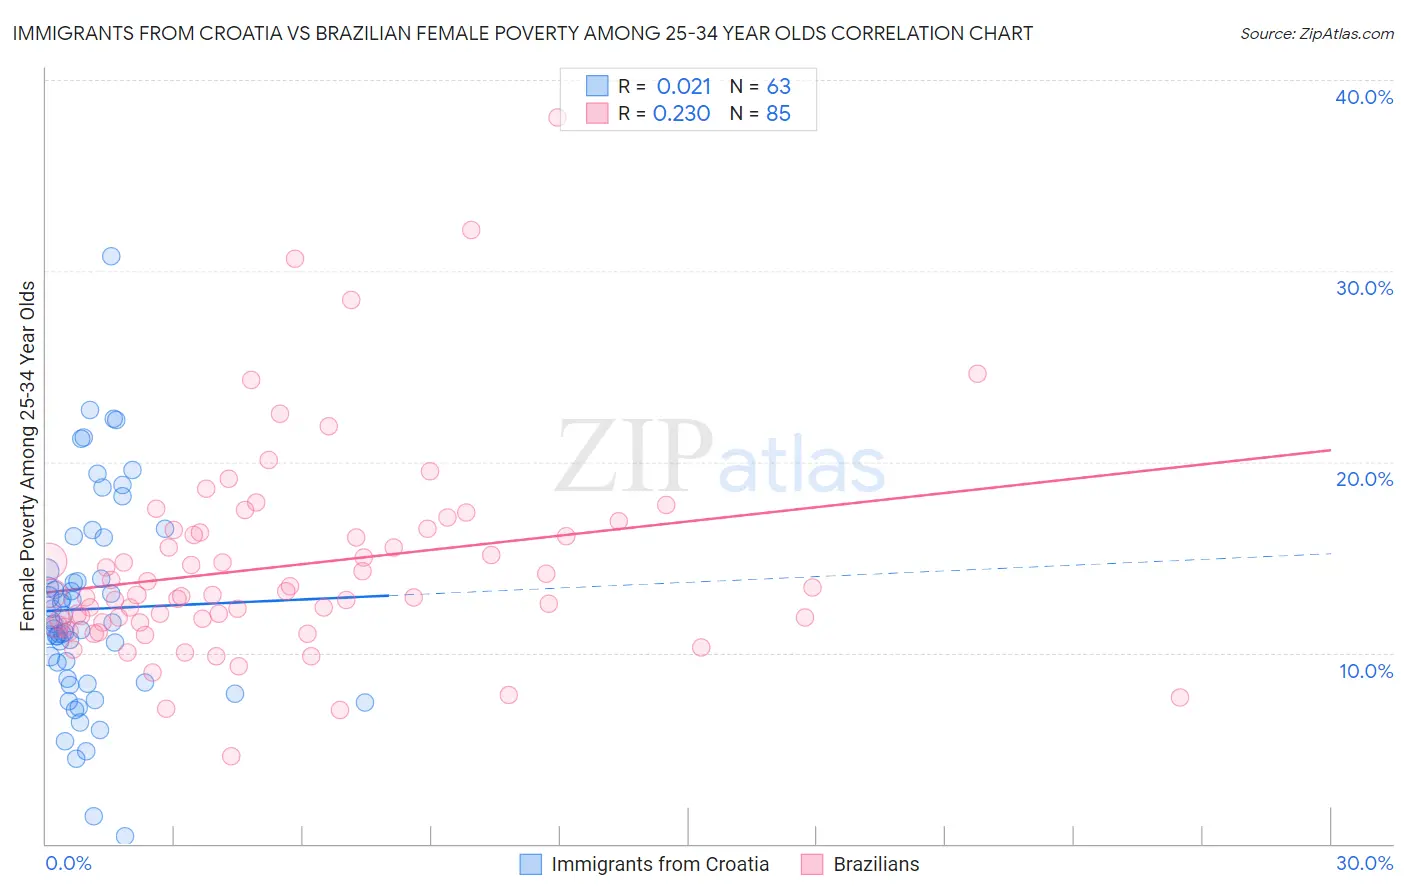
Immigrants from Croatia vs Brazilian Female Poverty Among 25-34 Year Olds Correlation Chart
The statistical analysis conducted on geographies consisting of 131,557,696 people shows no correlation between the proportion of Immigrants from Croatia and poverty level among females between the ages 25 and 34 in the United States with a correlation coefficient (R) of 0.021 and weighted average of 12.0%. Similarly, the statistical analysis conducted on geographies consisting of 319,734,086 people shows a weak positive correlation between the proportion of Brazilians and poverty level among females between the ages 25 and 34 in the United States with a correlation coefficient (R) of 0.230 and weighted average of 13.1%, a difference of 9.0%.
Female Poverty Among 25-34 Year Olds Correlation Summary
| Measurement | Immigrants from Croatia | Brazilian |
| Minimum | 0.42% | 4.6% |
| Maximum | 30.8% | 38.1% |
| Range | 30.3% | 33.5% |
| Mean | 12.3% | 14.6% |
| Median | 11.5% | 13.0% |
| Interquartile 25% (IQ1) | 8.5% | 11.6% |
| Interquartile 75% (IQ3) | 14.2% | 16.4% |
| Interquartile Range (IQR) | 5.8% | 4.8% |
| Standard Deviation (Sample) | 5.5% | 5.5% |
| Standard Deviation (Population) | 5.4% | 5.4% |
Similar Demographics by Female Poverty Among 25-34 Year Olds
Demographics Similar to Immigrants from Croatia by Female Poverty Among 25-34 Year Olds
In terms of female poverty among 25-34 year olds, the demographic groups most similar to Immigrants from Croatia are Paraguayan (12.0%, a difference of 0.010%), Immigrants from Egypt (12.0%, a difference of 0.020%), Immigrants from Eastern Europe (12.0%, a difference of 0.030%), Immigrants from Belarus (12.0%, a difference of 0.090%), and Korean (12.0%, a difference of 0.15%).
| Demographics | Rating | Rank | Female Poverty Among 25-34 Year Olds |
| Egyptians | 99.7 /100 | #43 | Exceptional 11.9% |
| Immigrants | Australia | 99.7 /100 | #44 | Exceptional 11.9% |
| Macedonians | 99.7 /100 | #45 | Exceptional 11.9% |
| Immigrants | Serbia | 99.7 /100 | #46 | Exceptional 11.9% |
| Koreans | 99.6 /100 | #47 | Exceptional 12.0% |
| Immigrants | Belarus | 99.6 /100 | #48 | Exceptional 12.0% |
| Immigrants | Egypt | 99.6 /100 | #49 | Exceptional 12.0% |
| Immigrants | Croatia | 99.6 /100 | #50 | Exceptional 12.0% |
| Paraguayans | 99.6 /100 | #51 | Exceptional 12.0% |
| Immigrants | Eastern Europe | 99.6 /100 | #52 | Exceptional 12.0% |
| Immigrants | Israel | 99.6 /100 | #53 | Exceptional 12.0% |
| Eastern Europeans | 99.6 /100 | #54 | Exceptional 12.0% |
| Immigrants | Philippines | 99.5 /100 | #55 | Exceptional 12.0% |
| Luxembourgers | 99.5 /100 | #56 | Exceptional 12.1% |
| Jordanians | 99.4 /100 | #57 | Exceptional 12.1% |
Demographics Similar to Brazilians by Female Poverty Among 25-34 Year Olds
In terms of female poverty among 25-34 year olds, the demographic groups most similar to Brazilians are Immigrants from Chile (13.1%, a difference of 0.010%), Austrian (13.1%, a difference of 0.13%), Immigrants from Iraq (13.1%, a difference of 0.15%), Immigrants from England (13.0%, a difference of 0.17%), and New Zealander (13.1%, a difference of 0.18%).
| Demographics | Rating | Rank | Female Poverty Among 25-34 Year Olds |
| Pakistanis | 88.4 /100 | #131 | Excellent 13.0% |
| Immigrants | Hungary | 88.3 /100 | #132 | Excellent 13.0% |
| Serbians | 87.6 /100 | #133 | Excellent 13.0% |
| Afghans | 85.8 /100 | #134 | Excellent 13.0% |
| South Africans | 85.7 /100 | #135 | Excellent 13.0% |
| Immigrants | England | 85.5 /100 | #136 | Excellent 13.0% |
| Immigrants | Chile | 84.6 /100 | #137 | Excellent 13.1% |
| Brazilians | 84.5 /100 | #138 | Excellent 13.1% |
| Austrians | 83.7 /100 | #139 | Excellent 13.1% |
| Immigrants | Iraq | 83.6 /100 | #140 | Excellent 13.1% |
| New Zealanders | 83.4 /100 | #141 | Excellent 13.1% |
| Scandinavians | 82.3 /100 | #142 | Excellent 13.1% |
| Israelis | 81.9 /100 | #143 | Excellent 13.1% |
| Native Hawaiians | 78.9 /100 | #144 | Good 13.2% |
| Colombians | 77.2 /100 | #145 | Good 13.2% |