Maltese vs Jamaican Female Poverty Among 18-24 Year Olds
COMPARE
Maltese
Jamaican
Female Poverty Among 18-24 Year Olds
Female Poverty Among 18-24 Year Olds Comparison
Maltese
Jamaicans
17.6%
FEMALE POVERTY AMONG 18-24 YEAR OLDS
100.0/ 100
METRIC RATING
24th/ 347
METRIC RANK
19.5%
FEMALE POVERTY AMONG 18-24 YEAR OLDS
92.1/ 100
METRIC RATING
132nd/ 347
METRIC RANK
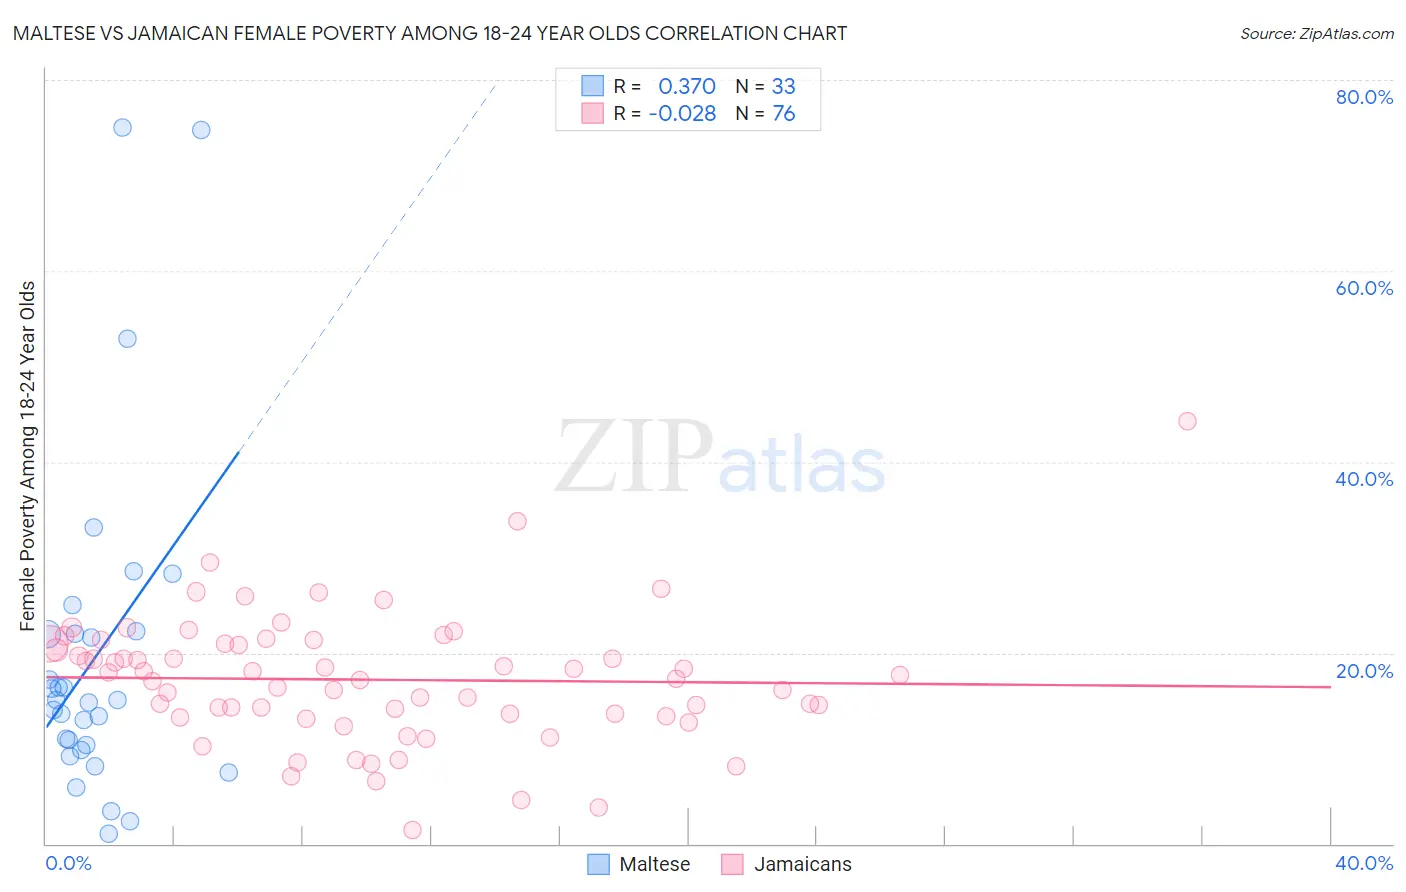
Maltese vs Jamaican Female Poverty Among 18-24 Year Olds Correlation Chart
The statistical analysis conducted on geographies consisting of 124,540,323 people shows a mild positive correlation between the proportion of Maltese and poverty level among females between the ages 18 and 24 in the United States with a correlation coefficient (R) of 0.370 and weighted average of 17.6%. Similarly, the statistical analysis conducted on geographies consisting of 360,459,370 people shows no correlation between the proportion of Jamaicans and poverty level among females between the ages 18 and 24 in the United States with a correlation coefficient (R) of -0.028 and weighted average of 19.5%, a difference of 11.0%.
Female Poverty Among 18-24 Year Olds Correlation Summary
| Measurement | Maltese | Jamaican |
| Minimum | 1.0% | 1.5% |
| Maximum | 75.0% | 44.3% |
| Range | 74.0% | 42.8% |
| Mean | 19.7% | 17.2% |
| Median | 15.0% | 17.5% |
| Interquartile 25% (IQ1) | 10.1% | 13.5% |
| Interquartile 75% (IQ3) | 22.1% | 21.0% |
| Interquartile Range (IQR) | 12.0% | 7.5% |
| Standard Deviation (Sample) | 17.4% | 6.8% |
| Standard Deviation (Population) | 17.1% | 6.7% |
Similar Demographics by Female Poverty Among 18-24 Year Olds
Demographics Similar to Maltese by Female Poverty Among 18-24 Year Olds
In terms of female poverty among 18-24 year olds, the demographic groups most similar to Maltese are Immigrants from North Macedonia (17.6%, a difference of 0.060%), Immigrants from South Central Asia (17.6%, a difference of 0.18%), Immigrants from Fiji (17.7%, a difference of 0.51%), Colombian (17.7%, a difference of 0.61%), and Immigrants from Hong Kong (17.5%, a difference of 0.63%).
| Demographics | Rating | Rank | Female Poverty Among 18-24 Year Olds |
| Immigrants | Taiwan | 100.0 /100 | #17 | Exceptional 17.3% |
| Immigrants | Colombia | 100.0 /100 | #18 | Exceptional 17.3% |
| Immigrants | Lithuania | 100.0 /100 | #19 | Exceptional 17.4% |
| Immigrants | Venezuela | 100.0 /100 | #20 | Exceptional 17.4% |
| Bolivians | 100.0 /100 | #21 | Exceptional 17.4% |
| Immigrants | Hong Kong | 100.0 /100 | #22 | Exceptional 17.5% |
| Immigrants | North Macedonia | 100.0 /100 | #23 | Exceptional 17.6% |
| Maltese | 100.0 /100 | #24 | Exceptional 17.6% |
| Immigrants | South Central Asia | 100.0 /100 | #25 | Exceptional 17.6% |
| Immigrants | Fiji | 100.0 /100 | #26 | Exceptional 17.7% |
| Colombians | 100.0 /100 | #27 | Exceptional 17.7% |
| Venezuelans | 100.0 /100 | #28 | Exceptional 17.7% |
| Portuguese | 100.0 /100 | #29 | Exceptional 17.8% |
| Immigrants | South Eastern Asia | 100.0 /100 | #30 | Exceptional 17.8% |
| Immigrants | Vietnam | 100.0 /100 | #31 | Exceptional 17.8% |
Demographics Similar to Jamaicans by Female Poverty Among 18-24 Year Olds
In terms of female poverty among 18-24 year olds, the demographic groups most similar to Jamaicans are Turkish (19.5%, a difference of 0.0%), Immigrants from North America (19.5%, a difference of 0.010%), Soviet Union (19.5%, a difference of 0.020%), Latvian (19.5%, a difference of 0.10%), and Russian (19.5%, a difference of 0.11%).
| Demographics | Rating | Rank | Female Poverty Among 18-24 Year Olds |
| Immigrants | Panama | 94.0 /100 | #125 | Exceptional 19.4% |
| Immigrants | Russia | 93.7 /100 | #126 | Exceptional 19.4% |
| Cape Verdeans | 93.6 /100 | #127 | Exceptional 19.4% |
| Slovaks | 92.9 /100 | #128 | Exceptional 19.5% |
| Immigrants | England | 92.9 /100 | #129 | Exceptional 19.5% |
| Immigrants | Canada | 92.9 /100 | #130 | Exceptional 19.5% |
| Latvians | 92.7 /100 | #131 | Exceptional 19.5% |
| Jamaicans | 92.1 /100 | #132 | Exceptional 19.5% |
| Turks | 92.1 /100 | #133 | Exceptional 19.5% |
| Immigrants | North America | 92.1 /100 | #134 | Exceptional 19.5% |
| Soviet Union | 92.0 /100 | #135 | Exceptional 19.5% |
| Russians | 91.5 /100 | #136 | Exceptional 19.5% |
| Austrians | 90.7 /100 | #137 | Exceptional 19.5% |
| Immigrants | Morocco | 89.9 /100 | #138 | Excellent 19.6% |
| Indians (Asian) | 88.3 /100 | #139 | Excellent 19.6% |