Maltese vs Immigrants from Albania Female Poverty Among 25-34 Year Olds
COMPARE
Maltese
Immigrants from Albania
Female Poverty Among 25-34 Year Olds
Female Poverty Among 25-34 Year Olds Comparison
Maltese
Immigrants from Albania
11.4%
FEMALE POVERTY AMONG 25-34 YEAR OLDS
99.9/ 100
METRIC RATING
24th/ 347
METRIC RANK
12.5%
FEMALE POVERTY AMONG 25-34 YEAR OLDS
97.1/ 100
METRIC RATING
90th/ 347
METRIC RANK
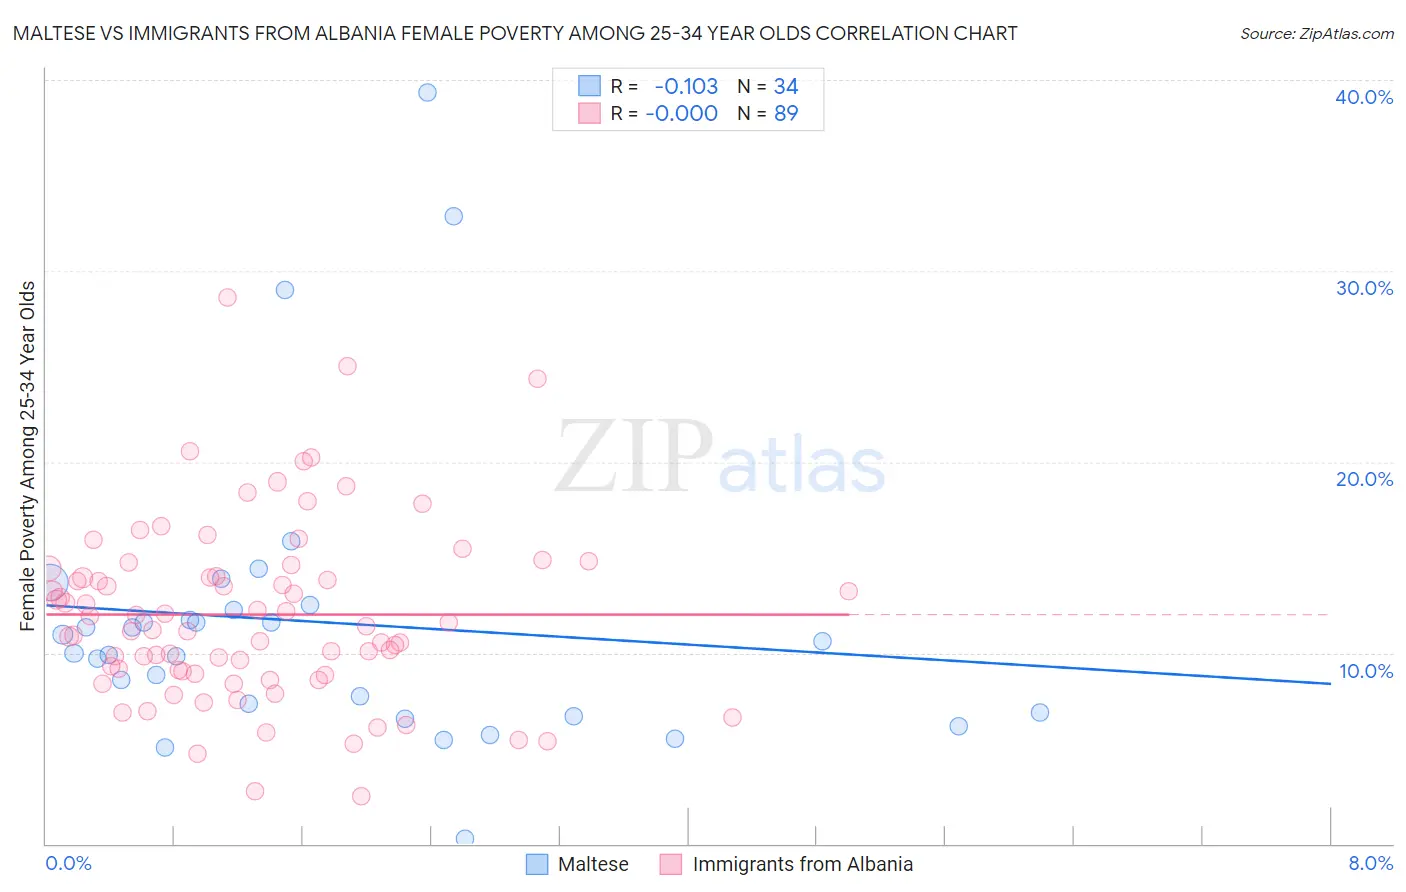
Maltese vs Immigrants from Albania Female Poverty Among 25-34 Year Olds Correlation Chart
The statistical analysis conducted on geographies consisting of 125,160,248 people shows a poor negative correlation between the proportion of Maltese and poverty level among females between the ages 25 and 34 in the United States with a correlation coefficient (R) of -0.103 and weighted average of 11.4%. Similarly, the statistical analysis conducted on geographies consisting of 118,599,932 people shows no correlation between the proportion of Immigrants from Albania and poverty level among females between the ages 25 and 34 in the United States with a correlation coefficient (R) of -0.000 and weighted average of 12.5%, a difference of 9.9%.
Female Poverty Among 25-34 Year Olds Correlation Summary
| Measurement | Maltese | Immigrants from Albania |
| Minimum | 0.28% | 2.5% |
| Maximum | 39.3% | 28.6% |
| Range | 39.0% | 26.1% |
| Mean | 11.6% | 12.0% |
| Median | 10.3% | 11.4% |
| Interquartile 25% (IQ1) | 6.9% | 9.0% |
| Interquartile 75% (IQ3) | 12.2% | 14.2% |
| Interquartile Range (IQR) | 5.3% | 5.2% |
| Standard Deviation (Sample) | 7.8% | 4.7% |
| Standard Deviation (Population) | 7.7% | 4.7% |
Similar Demographics by Female Poverty Among 25-34 Year Olds
Demographics Similar to Maltese by Female Poverty Among 25-34 Year Olds
In terms of female poverty among 25-34 year olds, the demographic groups most similar to Maltese are Bolivian (11.4%, a difference of 0.030%), Asian (11.4%, a difference of 0.090%), Bhutanese (11.4%, a difference of 0.22%), Turkish (11.4%, a difference of 0.24%), and Tongan (11.5%, a difference of 0.37%).
| Demographics | Rating | Rank | Female Poverty Among 25-34 Year Olds |
| Immigrants | China | 100.0 /100 | #17 | Exceptional 11.2% |
| Immigrants | Eastern Asia | 100.0 /100 | #18 | Exceptional 11.2% |
| Iranians | 100.0 /100 | #19 | Exceptional 11.2% |
| Okinawans | 100.0 /100 | #20 | Exceptional 11.3% |
| Turks | 100.0 /100 | #21 | Exceptional 11.4% |
| Asians | 99.9 /100 | #22 | Exceptional 11.4% |
| Bolivians | 99.9 /100 | #23 | Exceptional 11.4% |
| Maltese | 99.9 /100 | #24 | Exceptional 11.4% |
| Bhutanese | 99.9 /100 | #25 | Exceptional 11.4% |
| Tongans | 99.9 /100 | #26 | Exceptional 11.5% |
| Immigrants | Greece | 99.9 /100 | #27 | Exceptional 11.5% |
| Immigrants | Pakistan | 99.9 /100 | #28 | Exceptional 11.5% |
| Bulgarians | 99.9 /100 | #29 | Exceptional 11.5% |
| Cypriots | 99.9 /100 | #30 | Exceptional 11.5% |
| Immigrants | Japan | 99.9 /100 | #31 | Exceptional 11.6% |
Demographics Similar to Immigrants from Albania by Female Poverty Among 25-34 Year Olds
In terms of female poverty among 25-34 year olds, the demographic groups most similar to Immigrants from Albania are Norwegian (12.6%, a difference of 0.10%), Immigrants from Armenia (12.6%, a difference of 0.11%), Palestinian (12.6%, a difference of 0.14%), Italian (12.5%, a difference of 0.15%), and Immigrants from France (12.6%, a difference of 0.20%).
| Demographics | Rating | Rank | Female Poverty Among 25-34 Year Olds |
| Albanians | 97.7 /100 | #83 | Exceptional 12.5% |
| Immigrants | Latvia | 97.7 /100 | #84 | Exceptional 12.5% |
| Immigrants | South Eastern Asia | 97.6 /100 | #85 | Exceptional 12.5% |
| Croatians | 97.5 /100 | #86 | Exceptional 12.5% |
| Argentineans | 97.5 /100 | #87 | Exceptional 12.5% |
| Immigrants | Austria | 97.4 /100 | #88 | Exceptional 12.5% |
| Italians | 97.2 /100 | #89 | Exceptional 12.5% |
| Immigrants | Albania | 97.1 /100 | #90 | Exceptional 12.5% |
| Norwegians | 96.9 /100 | #91 | Exceptional 12.6% |
| Immigrants | Armenia | 96.9 /100 | #92 | Exceptional 12.6% |
| Palestinians | 96.9 /100 | #93 | Exceptional 12.6% |
| Immigrants | France | 96.8 /100 | #94 | Exceptional 12.6% |
| Ukrainians | 96.7 /100 | #95 | Exceptional 12.6% |
| Immigrants | Zimbabwe | 96.7 /100 | #96 | Exceptional 12.6% |
| Immigrants | Northern Africa | 96.6 /100 | #97 | Exceptional 12.6% |