Immigrants from Vietnam vs Bulgarian Seniors Poverty Over the Age of 75
COMPARE
Immigrants from Vietnam
Bulgarian
Seniors Poverty Over the Age of 75
Seniors Poverty Over the Age of 75 Comparison
Immigrants from Vietnam
Bulgarians
12.7%
SENIORS POVERTY OVER THE AGE OF 75
12.1/ 100
METRIC RATING
200th/ 347
METRIC RANK
10.7%
SENIORS POVERTY OVER THE AGE OF 75
99.8/ 100
METRIC RATING
26th/ 347
METRIC RANK
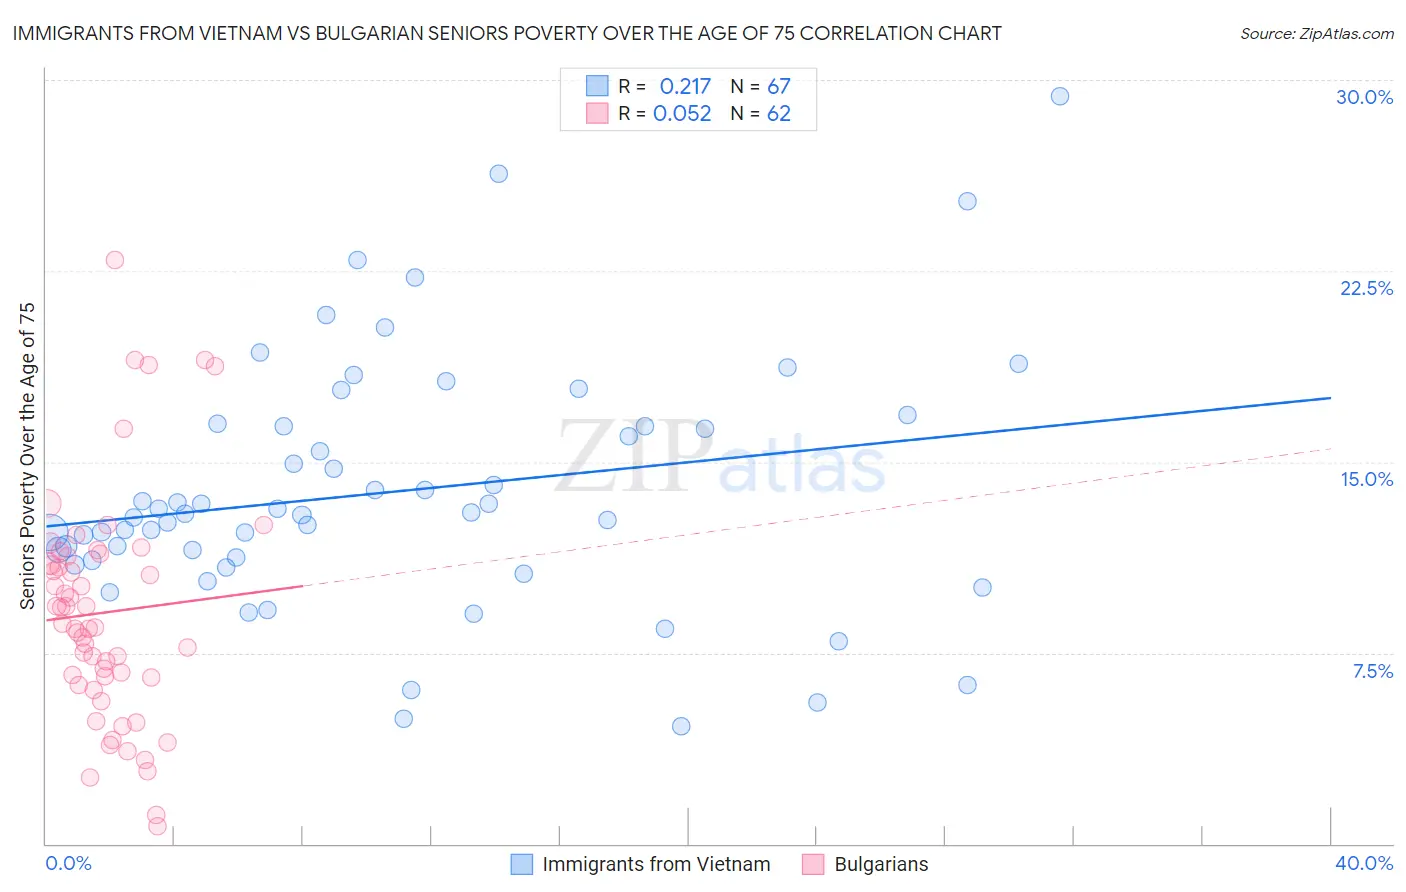
Immigrants from Vietnam vs Bulgarian Seniors Poverty Over the Age of 75 Correlation Chart
The statistical analysis conducted on geographies consisting of 400,421,667 people shows a weak positive correlation between the proportion of Immigrants from Vietnam and poverty level among seniors over the age of 75 in the United States with a correlation coefficient (R) of 0.217 and weighted average of 12.7%. Similarly, the statistical analysis conducted on geographies consisting of 204,615,916 people shows a slight positive correlation between the proportion of Bulgarians and poverty level among seniors over the age of 75 in the United States with a correlation coefficient (R) of 0.052 and weighted average of 10.7%, a difference of 19.0%.
Seniors Poverty Over the Age of 75 Correlation Summary
| Measurement | Immigrants from Vietnam | Bulgarian |
| Minimum | 4.6% | 0.68% |
| Maximum | 29.4% | 23.0% |
| Range | 24.8% | 22.3% |
| Mean | 13.8% | 9.1% |
| Median | 13.0% | 8.6% |
| Interquartile 25% (IQ1) | 11.1% | 6.5% |
| Interquartile 75% (IQ3) | 16.4% | 11.3% |
| Interquartile Range (IQR) | 5.3% | 4.8% |
| Standard Deviation (Sample) | 4.9% | 4.5% |
| Standard Deviation (Population) | 4.9% | 4.5% |
Similar Demographics by Seniors Poverty Over the Age of 75
Demographics Similar to Immigrants from Vietnam by Seniors Poverty Over the Age of 75
In terms of seniors poverty over the age of 75, the demographic groups most similar to Immigrants from Vietnam are Immigrants from Lebanon (12.7%, a difference of 0.10%), Paraguayan (12.7%, a difference of 0.20%), Arapaho (12.7%, a difference of 0.23%), Chilean (12.6%, a difference of 0.27%), and Immigrants from Southern Europe (12.7%, a difference of 0.29%).
| Demographics | Rating | Rank | Seniors Poverty Over the Age of 75 |
| Taiwanese | 17.8 /100 | #193 | Poor 12.6% |
| Alsatians | 17.7 /100 | #194 | Poor 12.6% |
| Immigrants | France | 17.4 /100 | #195 | Poor 12.6% |
| Immigrants | Eastern Europe | 16.0 /100 | #196 | Poor 12.6% |
| Nepalese | 14.4 /100 | #197 | Poor 12.6% |
| Chileans | 13.7 /100 | #198 | Poor 12.6% |
| Immigrants | Lebanon | 12.7 /100 | #199 | Poor 12.7% |
| Immigrants | Vietnam | 12.1 /100 | #200 | Poor 12.7% |
| Paraguayans | 11.1 /100 | #201 | Poor 12.7% |
| Arapaho | 10.9 /100 | #202 | Poor 12.7% |
| Immigrants | Southern Europe | 10.7 /100 | #203 | Poor 12.7% |
| Immigrants | Eritrea | 10.5 /100 | #204 | Poor 12.7% |
| Indians (Asian) | 9.7 /100 | #205 | Tragic 12.7% |
| Albanians | 9.6 /100 | #206 | Tragic 12.7% |
| Costa Ricans | 8.7 /100 | #207 | Tragic 12.8% |
Demographics Similar to Bulgarians by Seniors Poverty Over the Age of 75
In terms of seniors poverty over the age of 75, the demographic groups most similar to Bulgarians are Northern European (10.7%, a difference of 0.27%), Irish (10.7%, a difference of 0.33%), Assyrian/Chaldean/Syriac (10.7%, a difference of 0.48%), Swiss (10.7%, a difference of 0.56%), and Menominee (10.6%, a difference of 0.58%).
| Demographics | Rating | Rank | Seniors Poverty Over the Age of 75 |
| Immigrants | Scotland | 99.9 /100 | #19 | Exceptional 10.5% |
| Czechs | 99.9 /100 | #20 | Exceptional 10.5% |
| Slovenes | 99.9 /100 | #21 | Exceptional 10.6% |
| Bhutanese | 99.8 /100 | #22 | Exceptional 10.6% |
| Lithuanians | 99.8 /100 | #23 | Exceptional 10.6% |
| Poles | 99.8 /100 | #24 | Exceptional 10.6% |
| Menominee | 99.8 /100 | #25 | Exceptional 10.6% |
| Bulgarians | 99.8 /100 | #26 | Exceptional 10.7% |
| Northern Europeans | 99.8 /100 | #27 | Exceptional 10.7% |
| Irish | 99.8 /100 | #28 | Exceptional 10.7% |
| Assyrians/Chaldeans/Syriacs | 99.8 /100 | #29 | Exceptional 10.7% |
| Swiss | 99.7 /100 | #30 | Exceptional 10.7% |
| Marshallese | 99.7 /100 | #31 | Exceptional 10.7% |
| British | 99.7 /100 | #32 | Exceptional 10.7% |
| Puget Sound Salish | 99.7 /100 | #33 | Exceptional 10.8% |