Maltese vs Choctaw Seniors Poverty Over the Age of 75
COMPARE
Maltese
Choctaw
Seniors Poverty Over the Age of 75
Seniors Poverty Over the Age of 75 Comparison
Maltese
Choctaw
10.3%
SENIORS POVERTY OVER THE AGE OF 75
100.0/ 100
METRIC RATING
7th/ 347
METRIC RANK
12.5%
SENIORS POVERTY OVER THE AGE OF 75
20.2/ 100
METRIC RATING
192nd/ 347
METRIC RANK
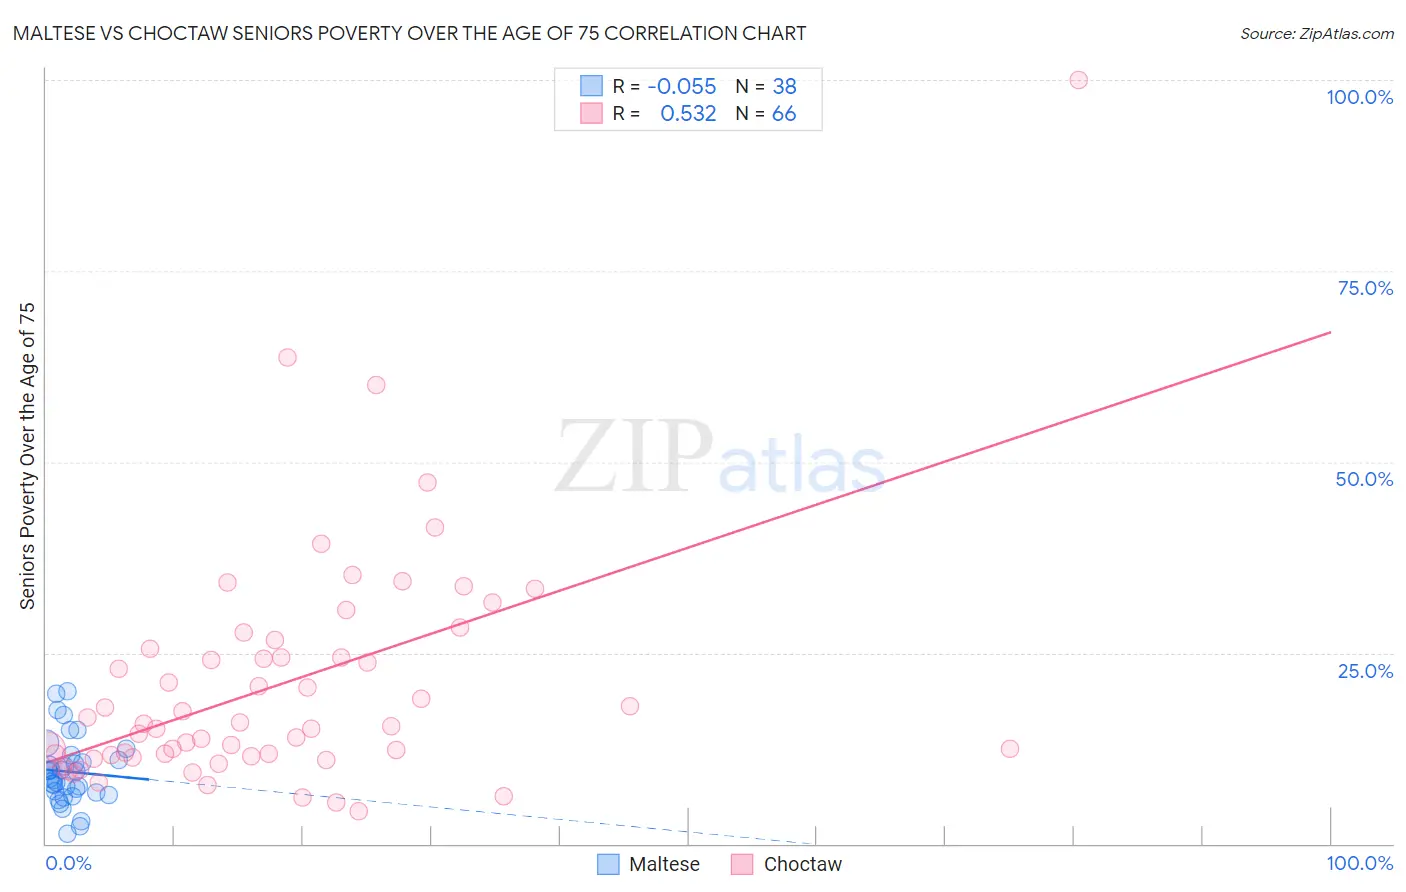
Maltese vs Choctaw Seniors Poverty Over the Age of 75 Correlation Chart
The statistical analysis conducted on geographies consisting of 126,057,505 people shows a slight negative correlation between the proportion of Maltese and poverty level among seniors over the age of 75 in the United States with a correlation coefficient (R) of -0.055 and weighted average of 10.3%. Similarly, the statistical analysis conducted on geographies consisting of 267,399,260 people shows a substantial positive correlation between the proportion of Choctaw and poverty level among seniors over the age of 75 in the United States with a correlation coefficient (R) of 0.532 and weighted average of 12.5%, a difference of 21.7%.
Seniors Poverty Over the Age of 75 Correlation Summary
| Measurement | Maltese | Choctaw |
| Minimum | 1.4% | 4.2% |
| Maximum | 19.9% | 100.0% |
| Range | 18.5% | 95.8% |
| Mean | 9.4% | 20.9% |
| Median | 9.0% | 15.6% |
| Interquartile 25% (IQ1) | 6.7% | 11.6% |
| Interquartile 75% (IQ3) | 10.9% | 25.5% |
| Interquartile Range (IQR) | 4.2% | 13.9% |
| Standard Deviation (Sample) | 4.4% | 15.7% |
| Standard Deviation (Population) | 4.3% | 15.6% |
Similar Demographics by Seniors Poverty Over the Age of 75
Demographics Similar to Maltese by Seniors Poverty Over the Age of 75
In terms of seniors poverty over the age of 75, the demographic groups most similar to Maltese are German (10.4%, a difference of 0.58%), Danish (10.2%, a difference of 0.65%), Norwegian (10.2%, a difference of 0.92%), English (10.4%, a difference of 0.92%), and Swedish (10.2%, a difference of 1.3%).
| Demographics | Rating | Rank | Seniors Poverty Over the Age of 75 |
| Chinese | 100.0 /100 | #1 | Exceptional 9.1% |
| Tlingit-Haida | 100.0 /100 | #2 | Exceptional 9.7% |
| Native Hawaiians | 100.0 /100 | #3 | Exceptional 10.1% |
| Swedes | 100.0 /100 | #4 | Exceptional 10.2% |
| Norwegians | 100.0 /100 | #5 | Exceptional 10.2% |
| Danes | 100.0 /100 | #6 | Exceptional 10.2% |
| Maltese | 100.0 /100 | #7 | Exceptional 10.3% |
| Germans | 99.9 /100 | #8 | Exceptional 10.4% |
| English | 99.9 /100 | #9 | Exceptional 10.4% |
| Scandinavians | 99.9 /100 | #10 | Exceptional 10.4% |
| Immigrants | India | 99.9 /100 | #11 | Exceptional 10.4% |
| Tongans | 99.9 /100 | #12 | Exceptional 10.5% |
| Croatians | 99.9 /100 | #13 | Exceptional 10.5% |
| Scottish | 99.9 /100 | #14 | Exceptional 10.5% |
| Europeans | 99.9 /100 | #15 | Exceptional 10.5% |
Demographics Similar to Choctaw by Seniors Poverty Over the Age of 75
In terms of seniors poverty over the age of 75, the demographic groups most similar to Choctaw are Taiwanese (12.6%, a difference of 0.31%), Alsatian (12.6%, a difference of 0.32%), Liberian (12.5%, a difference of 0.35%), Immigrants from France (12.6%, a difference of 0.37%), and Immigrants from Congo (12.5%, a difference of 0.42%).
| Demographics | Rating | Rank | Seniors Poverty Over the Age of 75 |
| Immigrants | Malaysia | 35.8 /100 | #185 | Fair 12.3% |
| Sri Lankans | 32.3 /100 | #186 | Fair 12.4% |
| Yaqui | 25.9 /100 | #187 | Fair 12.5% |
| Immigrants | Northern Africa | 25.2 /100 | #188 | Fair 12.5% |
| Immigrants | Indonesia | 24.4 /100 | #189 | Fair 12.5% |
| Immigrants | Congo | 23.9 /100 | #190 | Fair 12.5% |
| Liberians | 23.2 /100 | #191 | Fair 12.5% |
| Choctaw | 20.2 /100 | #192 | Fair 12.5% |
| Taiwanese | 17.8 /100 | #193 | Poor 12.6% |
| Alsatians | 17.7 /100 | #194 | Poor 12.6% |
| Immigrants | France | 17.4 /100 | #195 | Poor 12.6% |
| Immigrants | Eastern Europe | 16.0 /100 | #196 | Poor 12.6% |
| Nepalese | 14.4 /100 | #197 | Poor 12.6% |
| Chileans | 13.7 /100 | #198 | Poor 12.6% |
| Immigrants | Lebanon | 12.7 /100 | #199 | Poor 12.7% |