Malaysian vs Immigrants from Austria Child Poverty Among Girls Under 16
COMPARE
Malaysian
Immigrants from Austria
Child Poverty Among Girls Under 16
Child Poverty Among Girls Under 16 Comparison
Malaysians
Immigrants from Austria
17.8%
CHILD POVERTY AMONG GIRLS UNDER 16
5.7/ 100
METRIC RATING
214th/ 347
METRIC RANK
14.6%
CHILD POVERTY AMONG GIRLS UNDER 16
98.0/ 100
METRIC RATING
73rd/ 347
METRIC RANK
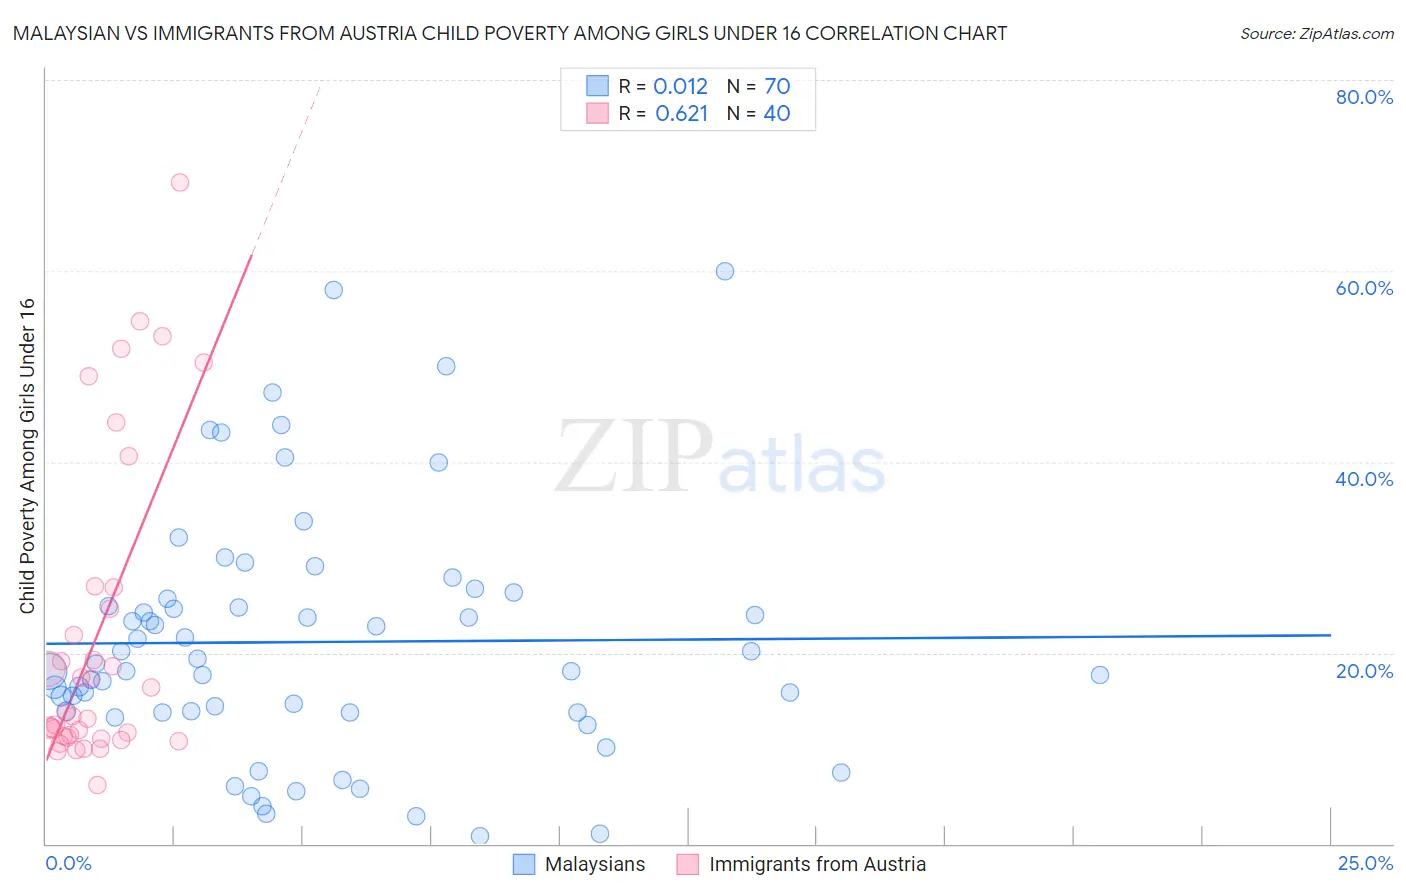
Malaysian vs Immigrants from Austria Child Poverty Among Girls Under 16 Correlation Chart
The statistical analysis conducted on geographies consisting of 224,243,890 people shows no correlation between the proportion of Malaysians and poverty level among girls under the age of 16 in the United States with a correlation coefficient (R) of 0.012 and weighted average of 17.8%. Similarly, the statistical analysis conducted on geographies consisting of 165,793,314 people shows a significant positive correlation between the proportion of Immigrants from Austria and poverty level among girls under the age of 16 in the United States with a correlation coefficient (R) of 0.621 and weighted average of 14.6%, a difference of 21.7%.
Child Poverty Among Girls Under 16 Correlation Summary
| Measurement | Malaysian | Immigrants from Austria |
| Minimum | 0.81% | 6.2% |
| Maximum | 60.0% | 69.2% |
| Range | 59.2% | 63.0% |
| Mean | 21.1% | 21.9% |
| Median | 18.5% | 13.6% |
| Interquartile 25% (IQ1) | 13.8% | 11.2% |
| Interquartile 75% (IQ3) | 25.6% | 25.8% |
| Interquartile Range (IQR) | 11.8% | 14.6% |
| Standard Deviation (Sample) | 12.9% | 16.2% |
| Standard Deviation (Population) | 12.8% | 16.0% |
Similar Demographics by Child Poverty Among Girls Under 16
Demographics Similar to Malaysians by Child Poverty Among Girls Under 16
In terms of child poverty among girls under 16, the demographic groups most similar to Malaysians are German Russian (17.8%, a difference of 0.0%), Pennsylvania German (17.8%, a difference of 0.020%), Moroccan (17.8%, a difference of 0.10%), Japanese (17.8%, a difference of 0.19%), and Immigrants from Thailand (17.7%, a difference of 0.28%).
| Demographics | Rating | Rank | Child Poverty Among Girls Under 16 |
| Hmong | 10.6 /100 | #207 | Poor 17.5% |
| Sierra Leoneans | 8.9 /100 | #208 | Tragic 17.6% |
| Panamanians | 8.7 /100 | #209 | Tragic 17.6% |
| Immigrants | Immigrants | 7.3 /100 | #210 | Tragic 17.7% |
| Immigrants | Eastern Africa | 6.4 /100 | #211 | Tragic 17.7% |
| Immigrants | Thailand | 6.3 /100 | #212 | Tragic 17.7% |
| Pennsylvania Germans | 5.7 /100 | #213 | Tragic 17.8% |
| Malaysians | 5.7 /100 | #214 | Tragic 17.8% |
| German Russians | 5.7 /100 | #215 | Tragic 17.8% |
| Moroccans | 5.5 /100 | #216 | Tragic 17.8% |
| Japanese | 5.3 /100 | #217 | Tragic 17.8% |
| Alaska Natives | 5.2 /100 | #218 | Tragic 17.8% |
| Immigrants | Panama | 4.7 /100 | #219 | Tragic 17.9% |
| Cubans | 4.1 /100 | #220 | Tragic 18.0% |
| Immigrants | Micronesia | 3.5 /100 | #221 | Tragic 18.0% |
Demographics Similar to Immigrants from Austria by Child Poverty Among Girls Under 16
In terms of child poverty among girls under 16, the demographic groups most similar to Immigrants from Austria are Taiwanese (14.6%, a difference of 0.030%), Immigrants from Netherlands (14.6%, a difference of 0.090%), Immigrants from Eastern Europe (14.6%, a difference of 0.10%), Slovene (14.6%, a difference of 0.12%), and European (14.6%, a difference of 0.16%).
| Demographics | Rating | Rank | Child Poverty Among Girls Under 16 |
| Immigrants | Belgium | 98.5 /100 | #66 | Exceptional 14.5% |
| Laotians | 98.4 /100 | #67 | Exceptional 14.5% |
| Immigrants | Argentina | 98.3 /100 | #68 | Exceptional 14.6% |
| Immigrants | Poland | 98.2 /100 | #69 | Exceptional 14.6% |
| Europeans | 98.1 /100 | #70 | Exceptional 14.6% |
| Slovenes | 98.1 /100 | #71 | Exceptional 14.6% |
| Immigrants | Netherlands | 98.1 /100 | #72 | Exceptional 14.6% |
| Immigrants | Austria | 98.0 /100 | #73 | Exceptional 14.6% |
| Taiwanese | 98.0 /100 | #74 | Exceptional 14.6% |
| Immigrants | Eastern Europe | 98.0 /100 | #75 | Exceptional 14.6% |
| Immigrants | Russia | 97.9 /100 | #76 | Exceptional 14.7% |
| Tlingit-Haida | 97.9 /100 | #77 | Exceptional 14.7% |
| Argentineans | 97.9 /100 | #78 | Exceptional 14.7% |
| Immigrants | Turkey | 97.9 /100 | #79 | Exceptional 14.7% |
| Egyptians | 97.9 /100 | #80 | Exceptional 14.7% |