Lebanese vs Hungarian Married-Couple Family Poverty
COMPARE
Lebanese
Hungarian
Married-Couple Family Poverty
Married-Couple Family Poverty Comparison
Lebanese
Hungarians
5.4%
MARRIED-COUPLE FAMILY POVERTY
24.1/ 100
METRIC RATING
201st/ 347
METRIC RANK
5.3%
MARRIED-COUPLE FAMILY POVERTY
34.7/ 100
METRIC RATING
186th/ 347
METRIC RANK
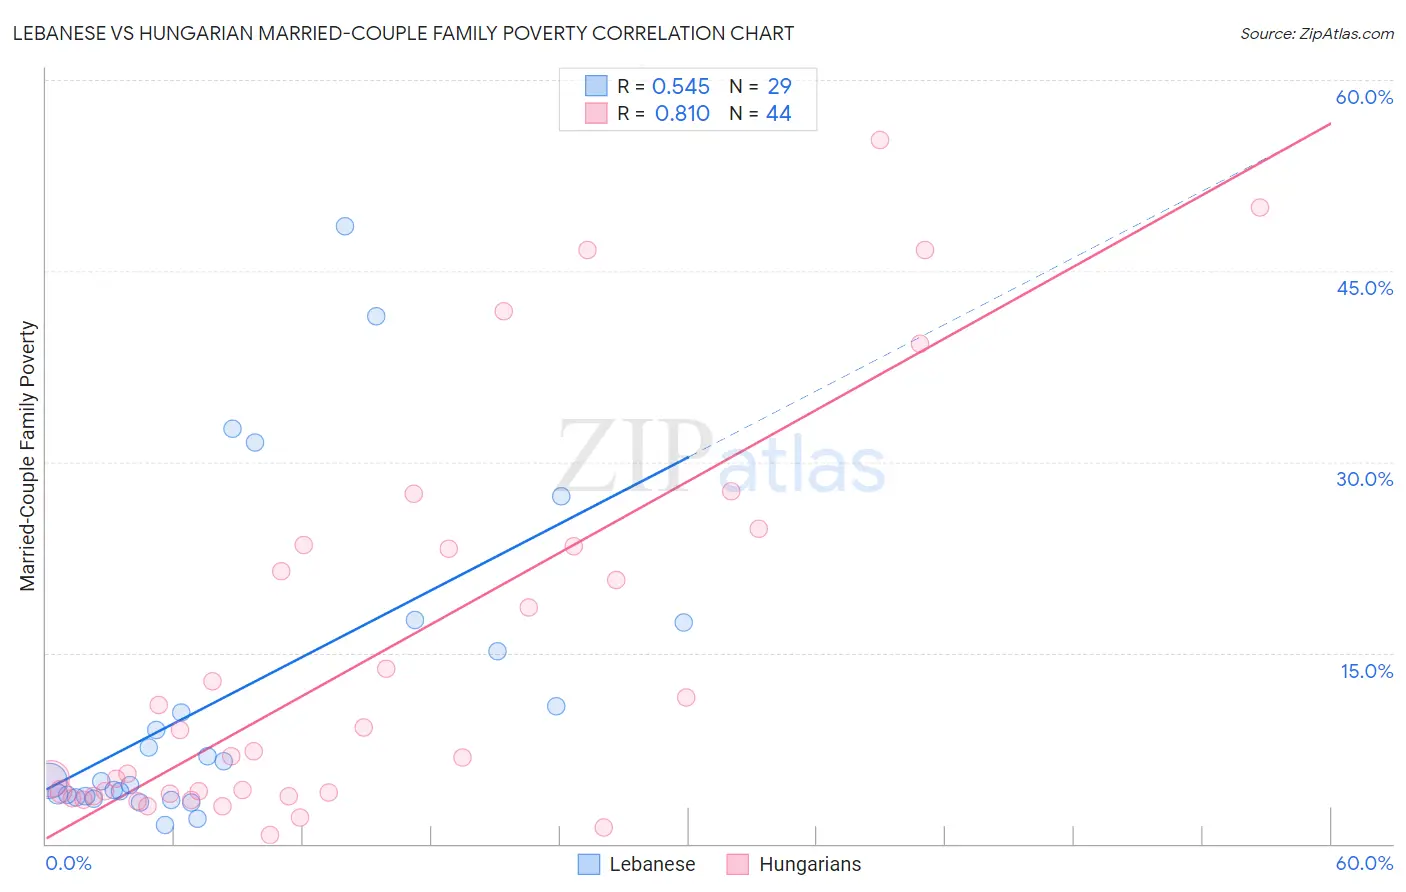
Lebanese vs Hungarian Married-Couple Family Poverty Correlation Chart
The statistical analysis conducted on geographies consisting of 397,468,310 people shows a substantial positive correlation between the proportion of Lebanese and poverty level among married-couple families in the United States with a correlation coefficient (R) of 0.545 and weighted average of 5.4%. Similarly, the statistical analysis conducted on geographies consisting of 478,217,673 people shows a very strong positive correlation between the proportion of Hungarians and poverty level among married-couple families in the United States with a correlation coefficient (R) of 0.810 and weighted average of 5.3%, a difference of 1.5%.
Married-Couple Family Poverty Correlation Summary
| Measurement | Lebanese | Hungarian |
| Minimum | 1.5% | 0.71% |
| Maximum | 48.5% | 55.3% |
| Range | 47.0% | 54.5% |
| Mean | 11.6% | 14.8% |
| Median | 4.9% | 7.0% |
| Interquartile 25% (IQ1) | 3.7% | 3.9% |
| Interquartile 75% (IQ3) | 16.3% | 23.3% |
| Interquartile Range (IQR) | 12.6% | 19.4% |
| Standard Deviation (Sample) | 12.6% | 15.1% |
| Standard Deviation (Population) | 12.4% | 14.9% |
Demographics Similar to Lebanese and Hungarians by Married-Couple Family Poverty
In terms of married-couple family poverty, the demographic groups most similar to Lebanese are Immigrants from Morocco (5.4%, a difference of 0.020%), Immigrants from Middle Africa (5.4%, a difference of 0.060%), Uruguayan (5.4%, a difference of 0.13%), Immigrants from Belarus (5.4%, a difference of 0.30%), and Liberian (5.4%, a difference of 0.33%). Similarly, the demographic groups most similar to Hungarians are American (5.3%, a difference of 0.080%), Immigrants from Albania (5.3%, a difference of 0.11%), Nonimmigrants (5.3%, a difference of 0.13%), Israeli (5.3%, a difference of 0.20%), and South American Indian (5.3%, a difference of 0.29%).
| Demographics | Rating | Rank | Married-Couple Family Poverty |
| Peruvians | 37.6 /100 | #183 | Fair 5.3% |
| Immigrants | Nonimmigrants | 35.8 /100 | #184 | Fair 5.3% |
| Americans | 35.4 /100 | #185 | Fair 5.3% |
| Hungarians | 34.7 /100 | #186 | Fair 5.3% |
| Immigrants | Albania | 33.8 /100 | #187 | Fair 5.3% |
| Israelis | 33.1 /100 | #188 | Fair 5.3% |
| South American Indians | 32.5 /100 | #189 | Fair 5.3% |
| Ugandans | 31.6 /100 | #190 | Fair 5.3% |
| Immigrants | Cabo Verde | 30.9 /100 | #191 | Fair 5.3% |
| Cape Verdeans | 30.7 /100 | #192 | Fair 5.3% |
| Malaysians | 29.5 /100 | #193 | Fair 5.4% |
| Immigrants | Israel | 27.8 /100 | #194 | Fair 5.4% |
| Immigrants | Azores | 27.5 /100 | #195 | Fair 5.4% |
| Spaniards | 27.4 /100 | #196 | Fair 5.4% |
| Liberians | 26.3 /100 | #197 | Fair 5.4% |
| Immigrants | Belarus | 26.2 /100 | #198 | Fair 5.4% |
| Uruguayans | 25.0 /100 | #199 | Fair 5.4% |
| Immigrants | Morocco | 24.3 /100 | #200 | Fair 5.4% |
| Lebanese | 24.1 /100 | #201 | Fair 5.4% |
| Immigrants | Middle Africa | 23.8 /100 | #202 | Fair 5.4% |
| Immigrants | Peru | 21.8 /100 | #203 | Fair 5.4% |