Lebanese vs Danish Seniors Poverty Over the Age of 75
COMPARE
Lebanese
Danish
Seniors Poverty Over the Age of 75
Seniors Poverty Over the Age of 75 Comparison
Lebanese
Danes
11.9%
SENIORS POVERTY OVER THE AGE OF 75
78.3/ 100
METRIC RATING
132nd/ 347
METRIC RANK
10.2%
SENIORS POVERTY OVER THE AGE OF 75
100.0/ 100
METRIC RATING
6th/ 347
METRIC RANK
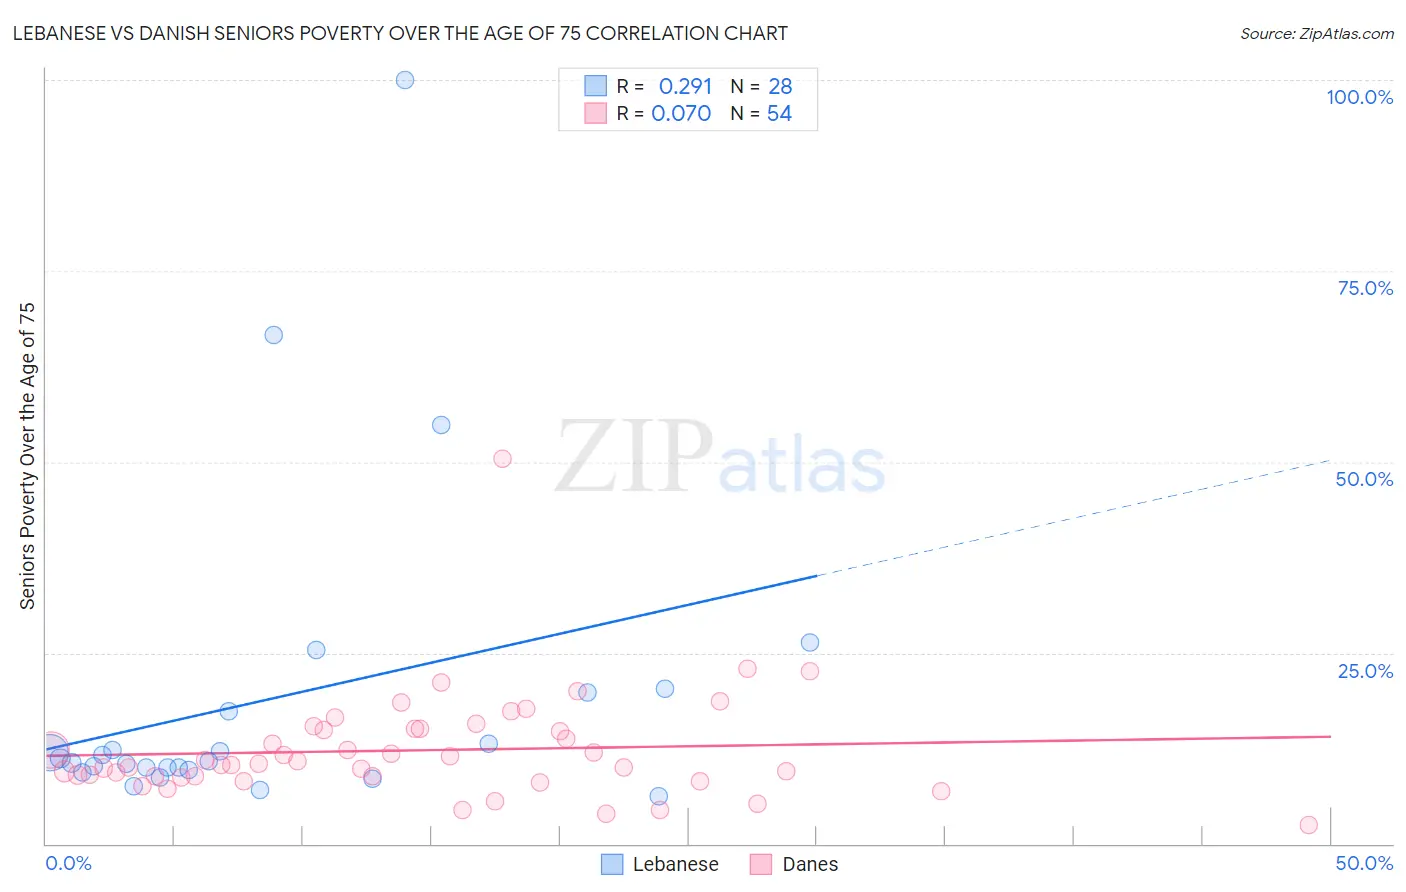
Lebanese vs Danish Seniors Poverty Over the Age of 75 Correlation Chart
The statistical analysis conducted on geographies consisting of 396,652,503 people shows a weak positive correlation between the proportion of Lebanese and poverty level among seniors over the age of 75 in the United States with a correlation coefficient (R) of 0.291 and weighted average of 11.9%. Similarly, the statistical analysis conducted on geographies consisting of 465,098,722 people shows a slight positive correlation between the proportion of Danes and poverty level among seniors over the age of 75 in the United States with a correlation coefficient (R) of 0.070 and weighted average of 10.2%, a difference of 16.1%.
Seniors Poverty Over the Age of 75 Correlation Summary
| Measurement | Lebanese | Danish |
| Minimum | 6.2% | 2.5% |
| Maximum | 100.0% | 50.3% |
| Range | 93.8% | 47.8% |
| Mean | 19.0% | 12.2% |
| Median | 11.0% | 10.4% |
| Interquartile 25% (IQ1) | 9.8% | 8.8% |
| Interquartile 75% (IQ3) | 18.6% | 15.1% |
| Interquartile Range (IQR) | 8.8% | 6.3% |
| Standard Deviation (Sample) | 21.0% | 7.1% |
| Standard Deviation (Population) | 20.6% | 7.0% |
Similar Demographics by Seniors Poverty Over the Age of 75
Demographics Similar to Lebanese by Seniors Poverty Over the Age of 75
In terms of seniors poverty over the age of 75, the demographic groups most similar to Lebanese are Immigrants from Sierra Leone (11.9%, a difference of 0.090%), Ugandan (11.9%, a difference of 0.15%), Immigrants from Western Europe (11.9%, a difference of 0.16%), Immigrants from Ireland (11.9%, a difference of 0.25%), and Spanish (11.8%, a difference of 0.28%).
| Demographics | Rating | Rank | Seniors Poverty Over the Age of 75 |
| Sudanese | 83.6 /100 | #125 | Excellent 11.8% |
| Pennsylvania Germans | 83.4 /100 | #126 | Excellent 11.8% |
| Immigrants | Denmark | 82.6 /100 | #127 | Excellent 11.8% |
| Immigrants | Hungary | 81.7 /100 | #128 | Excellent 11.8% |
| Ethiopians | 80.7 /100 | #129 | Excellent 11.8% |
| Spanish | 80.5 /100 | #130 | Excellent 11.8% |
| Immigrants | Western Europe | 79.6 /100 | #131 | Good 11.9% |
| Lebanese | 78.3 /100 | #132 | Good 11.9% |
| Immigrants | Sierra Leone | 77.6 /100 | #133 | Good 11.9% |
| Ugandans | 77.1 /100 | #134 | Good 11.9% |
| Immigrants | Ireland | 76.2 /100 | #135 | Good 11.9% |
| Immigrants | Philippines | 75.0 /100 | #136 | Good 11.9% |
| Immigrants | Moldova | 74.1 /100 | #137 | Good 11.9% |
| Immigrants | Romania | 72.6 /100 | #138 | Good 11.9% |
| Immigrants | Kenya | 72.6 /100 | #139 | Good 11.9% |
Demographics Similar to Danes by Seniors Poverty Over the Age of 75
In terms of seniors poverty over the age of 75, the demographic groups most similar to Danes are Norwegian (10.2%, a difference of 0.27%), Maltese (10.3%, a difference of 0.65%), Swedish (10.2%, a difference of 0.67%), German (10.4%, a difference of 1.2%), and Native Hawaiian (10.1%, a difference of 1.5%).
| Demographics | Rating | Rank | Seniors Poverty Over the Age of 75 |
| Chinese | 100.0 /100 | #1 | Exceptional 9.1% |
| Tlingit-Haida | 100.0 /100 | #2 | Exceptional 9.7% |
| Native Hawaiians | 100.0 /100 | #3 | Exceptional 10.1% |
| Swedes | 100.0 /100 | #4 | Exceptional 10.2% |
| Norwegians | 100.0 /100 | #5 | Exceptional 10.2% |
| Danes | 100.0 /100 | #6 | Exceptional 10.2% |
| Maltese | 100.0 /100 | #7 | Exceptional 10.3% |
| Germans | 99.9 /100 | #8 | Exceptional 10.4% |
| English | 99.9 /100 | #9 | Exceptional 10.4% |
| Scandinavians | 99.9 /100 | #10 | Exceptional 10.4% |
| Immigrants | India | 99.9 /100 | #11 | Exceptional 10.4% |
| Tongans | 99.9 /100 | #12 | Exceptional 10.5% |
| Croatians | 99.9 /100 | #13 | Exceptional 10.5% |
| Scottish | 99.9 /100 | #14 | Exceptional 10.5% |
| Europeans | 99.9 /100 | #15 | Exceptional 10.5% |