Laotian vs Thai Child Poverty Among Boys Under 16
COMPARE
Laotian
Thai
Child Poverty Among Boys Under 16
Child Poverty Among Boys Under 16 Comparison
Laotians
Thais
14.3%
CHILD POVERTY AMONG BOYS UNDER 16
99.0/ 100
METRIC RATING
52nd/ 347
METRIC RANK
11.7%
CHILD POVERTY AMONG BOYS UNDER 16
100.0/ 100
METRIC RATING
4th/ 347
METRIC RANK
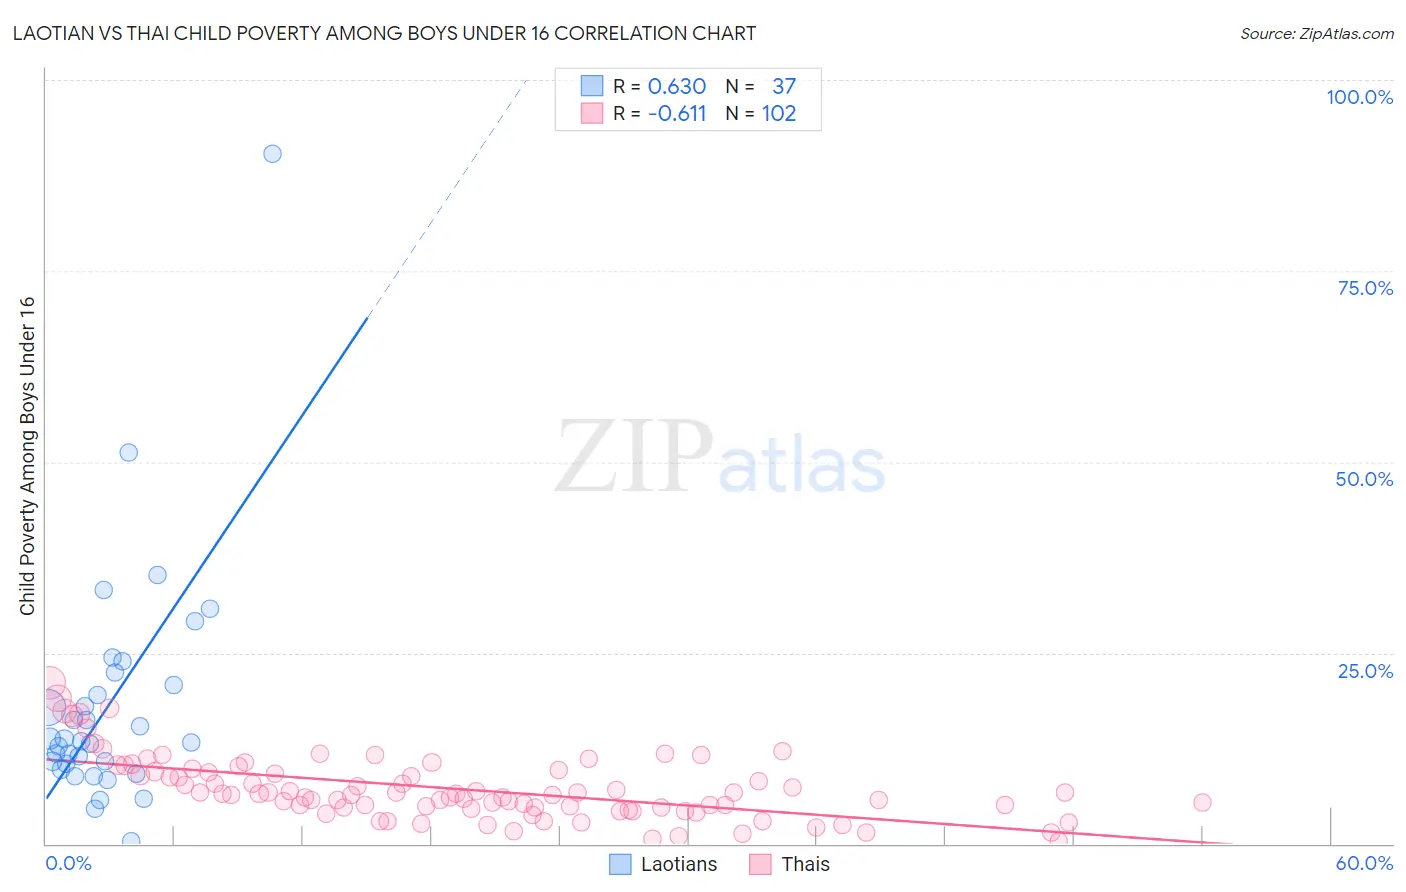
Laotian vs Thai Child Poverty Among Boys Under 16 Correlation Chart
The statistical analysis conducted on geographies consisting of 223,108,732 people shows a significant positive correlation between the proportion of Laotians and poverty level among boys under the age of 16 in the United States with a correlation coefficient (R) of 0.630 and weighted average of 14.3%. Similarly, the statistical analysis conducted on geographies consisting of 465,293,416 people shows a significant negative correlation between the proportion of Thais and poverty level among boys under the age of 16 in the United States with a correlation coefficient (R) of -0.611 and weighted average of 11.7%, a difference of 22.7%.
Child Poverty Among Boys Under 16 Correlation Summary
| Measurement | Laotian | Thai |
| Minimum | 0.40% | 0.37% |
| Maximum | 90.3% | 21.1% |
| Range | 89.9% | 20.7% |
| Mean | 18.2% | 7.2% |
| Median | 13.4% | 6.4% |
| Interquartile 25% (IQ1) | 10.1% | 4.7% |
| Interquartile 75% (IQ3) | 21.5% | 9.4% |
| Interquartile Range (IQR) | 11.4% | 4.7% |
| Standard Deviation (Sample) | 15.7% | 4.1% |
| Standard Deviation (Population) | 15.5% | 4.1% |
Similar Demographics by Child Poverty Among Boys Under 16
Demographics Similar to Laotians by Child Poverty Among Boys Under 16
In terms of child poverty among boys under 16, the demographic groups most similar to Laotians are Immigrants from Philippines (14.3%, a difference of 0.040%), Immigrants from Serbia (14.3%, a difference of 0.12%), Immigrants from Pakistan (14.3%, a difference of 0.17%), Zimbabwean (14.3%, a difference of 0.17%), and Polish (14.4%, a difference of 0.28%).
| Demographics | Rating | Rank | Child Poverty Among Boys Under 16 |
| Immigrants | Scotland | 99.4 /100 | #45 | Exceptional 14.1% |
| Greeks | 99.4 /100 | #46 | Exceptional 14.1% |
| Immigrants | Moldova | 99.4 /100 | #47 | Exceptional 14.1% |
| Immigrants | Indonesia | 99.4 /100 | #48 | Exceptional 14.1% |
| Czechs | 99.3 /100 | #49 | Exceptional 14.1% |
| Italians | 99.2 /100 | #50 | Exceptional 14.2% |
| Immigrants | Greece | 99.2 /100 | #51 | Exceptional 14.2% |
| Laotians | 99.0 /100 | #52 | Exceptional 14.3% |
| Immigrants | Philippines | 99.0 /100 | #53 | Exceptional 14.3% |
| Immigrants | Serbia | 99.0 /100 | #54 | Exceptional 14.3% |
| Immigrants | Pakistan | 99.0 /100 | #55 | Exceptional 14.3% |
| Zimbabweans | 99.0 /100 | #56 | Exceptional 14.3% |
| Poles | 98.9 /100 | #57 | Exceptional 14.4% |
| Immigrants | Sweden | 98.9 /100 | #58 | Exceptional 14.4% |
| Immigrants | Czechoslovakia | 98.9 /100 | #59 | Exceptional 14.4% |
Demographics Similar to Thais by Child Poverty Among Boys Under 16
In terms of child poverty among boys under 16, the demographic groups most similar to Thais are Chinese (11.9%, a difference of 1.6%), Immigrants from Hong Kong (12.3%, a difference of 4.9%), Filipino (11.1%, a difference of 5.1%), Immigrants from Taiwan (11.0%, a difference of 5.9%), and Iranian (12.4%, a difference of 6.6%).
| Demographics | Rating | Rank | Child Poverty Among Boys Under 16 |
| Immigrants | India | 100.0 /100 | #1 | Exceptional 10.9% |
| Immigrants | Taiwan | 100.0 /100 | #2 | Exceptional 11.0% |
| Filipinos | 100.0 /100 | #3 | Exceptional 11.1% |
| Thais | 100.0 /100 | #4 | Exceptional 11.7% |
| Chinese | 100.0 /100 | #5 | Exceptional 11.9% |
| Immigrants | Hong Kong | 100.0 /100 | #6 | Exceptional 12.3% |
| Iranians | 100.0 /100 | #7 | Exceptional 12.4% |
| Immigrants | Singapore | 100.0 /100 | #8 | Exceptional 12.5% |
| Immigrants | Iran | 100.0 /100 | #9 | Exceptional 12.5% |
| Bhutanese | 100.0 /100 | #10 | Exceptional 12.6% |
| Immigrants | South Central Asia | 100.0 /100 | #11 | Exceptional 12.7% |
| Burmese | 99.9 /100 | #12 | Exceptional 13.0% |
| Immigrants | Korea | 99.9 /100 | #13 | Exceptional 13.0% |
| Immigrants | Ireland | 99.9 /100 | #14 | Exceptional 13.1% |
| Immigrants | Japan | 99.9 /100 | #15 | Exceptional 13.1% |