Immigrants from Micronesia vs Thai Child Poverty Among Boys Under 16

COMPARE

Immigrants from Micronesia
Race
Ancestry
AfghanAfricanAlaska NativeAlaskan AthabascanAlbanianAleutAlsatianAmericanApacheArabArapahoArgentineanArmenianAssyrian/Chaldean/SyriacAustralianAustrianBahamianBangladeshiBarbadianBasqueBelgianBelizeanBermudanBhutaneseBlackfeetBolivianBrazilianBritishBritish West IndianBulgarianBurmeseCajunCambodianCanadianCape VerdeanCarpatho RusynCelticCentral AmericanCentral American IndianCherokeeCheyenneChickasawChileanChineseChippewaChoctawColombianColvilleComancheCosta RicanCreeCreekCroatianCrowCubanCypriotCzechCzechoslovakianDanishDelawareDominicanDutchDutch West IndianEastern EuropeanEcuadorianEgyptianEnglishEstonianEthiopianEuropeanFijianFilipinoFinnishFrenchFrench American IndianFrench CanadianGermanGerman RussianGhanaianGreekGuamanian/ChamorroGuatemalanGuyaneseHaitianHmongHonduranHopiHoumaHungarianIcelanderIndian (Asian)IndonesianInupiatIranianIraqiIrishIroquoisIsraeliItalianJamaicanJapaneseJordanianKenyanKiowaKoreanLaotianLatvianLebaneseLiberianLithuanianLumbeeLuxembourgerMacedonianMalaysianMalteseMarshalleseMenomineeMexicanMexican American IndianMongolianMoroccanNative HawaiianNavajoNepaleseNew ZealanderNicaraguanNigerianNorthern EuropeanNorwegianOkinawanOsageOttawaPaiutePakistaniPalestinianPanamanianParaguayanPennsylvania GermanPeruvianPimaPolishPortuguesePotawatomiPuebloPuerto RicanPuget Sound SalishRomanianRussianSalvadoranSamoanScandinavianScotch-IrishScottishSeminoleSenegaleseSerbianShoshoneSierra LeoneanSiouxSlavicSlovakSloveneSomaliSouth AfricanSouth AmericanSouth American IndianSoviet UnionSpaniardSpanishSpanish AmericanSpanish American IndianSri LankanSubsaharan AfricanSudaneseSwedishSwissSyrianTaiwaneseTlingit-HaidaTohono O'OdhamTonganTrinidadian and TobagonianTsimshianTurkishU.S. Virgin IslanderUgandanUkrainianUruguayanUteVenezuelanVietnameseWelshWest IndianYakamaYaquiYugoslavianYumanYup'ikZimbabwean
Immigration
NonimmigrantsImmigrantsAfghanistanAfricaAlbaniaArgentinaArmeniaAsiaAustraliaAustriaBahamasBangladeshBarbadosBelarusBelgiumBelizeBoliviaBosnia and HerzegovinaBrazilBulgariaBurma/MyanmarCabo VerdeCambodiaCameroonCanadaCaribbeanCentral AmericaChileChinaColombiaCongoCosta RicaCroatiaCubaCzechoslovakiaDenmarkDominicaDominican RepublicEastern AfricaEastern AsiaEastern EuropeEcuadorEgyptEl SalvadorEnglandEritreaEthiopiaEuropeFijiFranceGermanyGhanaGreeceGrenadaGuatemalaGuyanaHaitiHondurasHong KongHungaryIndiaIndonesiaIranIraqIrelandIsraelItalyJamaicaJapanJordanKazakhstanKenyaKoreaKuwaitLaosLatin AmericaLatviaLebanonLiberiaLithuaniaMalaysiaMexicoMicronesiaMiddle AfricaMoldovaMoroccoNepalNetherlandsNicaraguaNigeriaNorth AmericaNorth MacedoniaNorthern AfricaNorthern EuropeNorwayOceaniaPakistanPanamaPeruPhilippinesPolandPortugalRomaniaRussiaSaudi ArabiaScotlandSenegalSerbiaSierra LeoneSingaporeSomaliaSouth AfricaSouth AmericaSouth Central AsiaSouth Eastern AsiaSouthern EuropeSpainSri LankaSt. Vincent and the GrenadinesSudanSwedenSwitzerlandSyriaTaiwanThailandTrinidad and TobagoTurkeyUgandaUkraineUruguayUzbekistanVenezuelaVietnamWest IndiesWestern AfricaWestern AsiaWestern EuropeYemenZaireZimbabweAzores
Thai
Race
Ancestry
AfghanAfricanAlaska NativeAlaskan AthabascanAlbanianAleutAlsatianAmericanApacheArabArapahoArgentineanArmenianAssyrian/Chaldean/SyriacAustralianAustrianBahamianBangladeshiBarbadianBasqueBelgianBelizeanBermudanBhutaneseBlackfeetBolivianBrazilianBritishBritish West IndianBulgarianBurmeseCajunCambodianCanadianCape VerdeanCarpatho RusynCelticCentral AmericanCentral American IndianCherokeeCheyenneChickasawChileanChineseChippewaChoctawColombianColvilleComancheCosta RicanCreeCreekCroatianCrowCubanCypriotCzechCzechoslovakianDanishDelawareDominicanDutchDutch West IndianEastern EuropeanEcuadorianEgyptianEnglishEstonianEthiopianEuropeanFijianFilipinoFinnishFrenchFrench American IndianFrench CanadianGermanGerman RussianGhanaianGreekGuamanian/ChamorroGuatemalanGuyaneseHaitianHmongHonduranHopiHoumaHungarianIcelanderIndian (Asian)IndonesianInupiatIranianIraqiIrishIroquoisIsraeliItalianJamaicanJapaneseJordanianKenyanKiowaKoreanLaotianLatvianLebaneseLiberianLithuanianLumbeeLuxembourgerMacedonianMalaysianMalteseMarshalleseMenomineeMexicanMexican American IndianMongolianMoroccanNative HawaiianNavajoNepaleseNew ZealanderNicaraguanNigerianNorthern EuropeanNorwegianOkinawanOsageOttawaPaiutePakistaniPalestinianPanamanianParaguayanPennsylvania GermanPeruvianPimaPolishPortuguesePotawatomiPuebloPuerto RicanPuget Sound SalishRomanianRussianSalvadoranSamoanScandinavianScotch-IrishScottishSeminoleSenegaleseSerbianShoshoneSierra LeoneanSiouxSlavicSlovakSloveneSomaliSouth AfricanSouth AmericanSouth American IndianSoviet UnionSpaniardSpanishSpanish AmericanSpanish American IndianSri LankanSubsaharan AfricanSudaneseSwedishSwissSyrianTaiwaneseThaiTlingit-HaidaTohono O'OdhamTonganTrinidadian and TobagonianTsimshianTurkishU.S. Virgin IslanderUgandanUkrainianUruguayanUteVenezuelanVietnameseWelshWest IndianYakamaYaquiYugoslavianYumanYup'ikZimbabwean
Immigration
NonimmigrantsImmigrantsAfghanistanAfricaAlbaniaArgentinaArmeniaAsiaAustraliaAustriaBahamasBangladeshBarbadosBelarusBelgiumBelizeBoliviaBosnia and HerzegovinaBrazilBulgariaBurma/MyanmarCabo VerdeCambodiaCameroonCanadaCaribbeanCentral AmericaChileChinaColombiaCongoCosta RicaCroatiaCubaCzechoslovakiaDenmarkDominicaDominican RepublicEastern AfricaEastern AsiaEastern EuropeEcuadorEgyptEl SalvadorEnglandEritreaEthiopiaEuropeFijiFranceGermanyGhanaGreeceGrenadaGuatemalaGuyanaHaitiHondurasHong KongHungaryIndiaIndonesiaIranIraqIrelandIsraelItalyJamaicaJapanJordanKazakhstanKenyaKoreaKuwaitLaosLatin AmericaLatviaLebanonLiberiaLithuaniaMalaysiaMexicoMiddle AfricaMoldovaMoroccoNepalNetherlandsNicaraguaNigeriaNorth AmericaNorth MacedoniaNorthern AfricaNorthern EuropeNorwayOceaniaPakistanPanamaPeruPhilippinesPolandPortugalRomaniaRussiaSaudi ArabiaScotlandSenegalSerbiaSierra LeoneSingaporeSomaliaSouth AfricaSouth AmericaSouth Central AsiaSouth Eastern AsiaSouthern EuropeSpainSri LankaSt. Vincent and the GrenadinesSudanSwedenSwitzerlandSyriaTaiwanThailandTrinidad and TobagoTurkeyUgandaUkraineUruguayUzbekistanVenezuelaVietnamWest IndiesWestern AfricaWestern AsiaWestern EuropeYemenZaireZimbabweAzores
Child Poverty Among Boys Under 16
Income
Poverty
Unemployment
Labor Participation
Family Structure
Vehicle Availability
Education Level
Disability

Child Poverty Among Boys Under 16 Comparison

Immigrants from Micronesia

Thais

Tragic
Exceptional
18.3%
CHILD POVERTY AMONG BOYS UNDER 16
1.8/ 100
METRIC RATING
229th/ 347
METRIC RANK
11.7%
CHILD POVERTY AMONG BOYS UNDER 16
100.0/ 100
METRIC RATING
4th/ 347
METRIC RANK

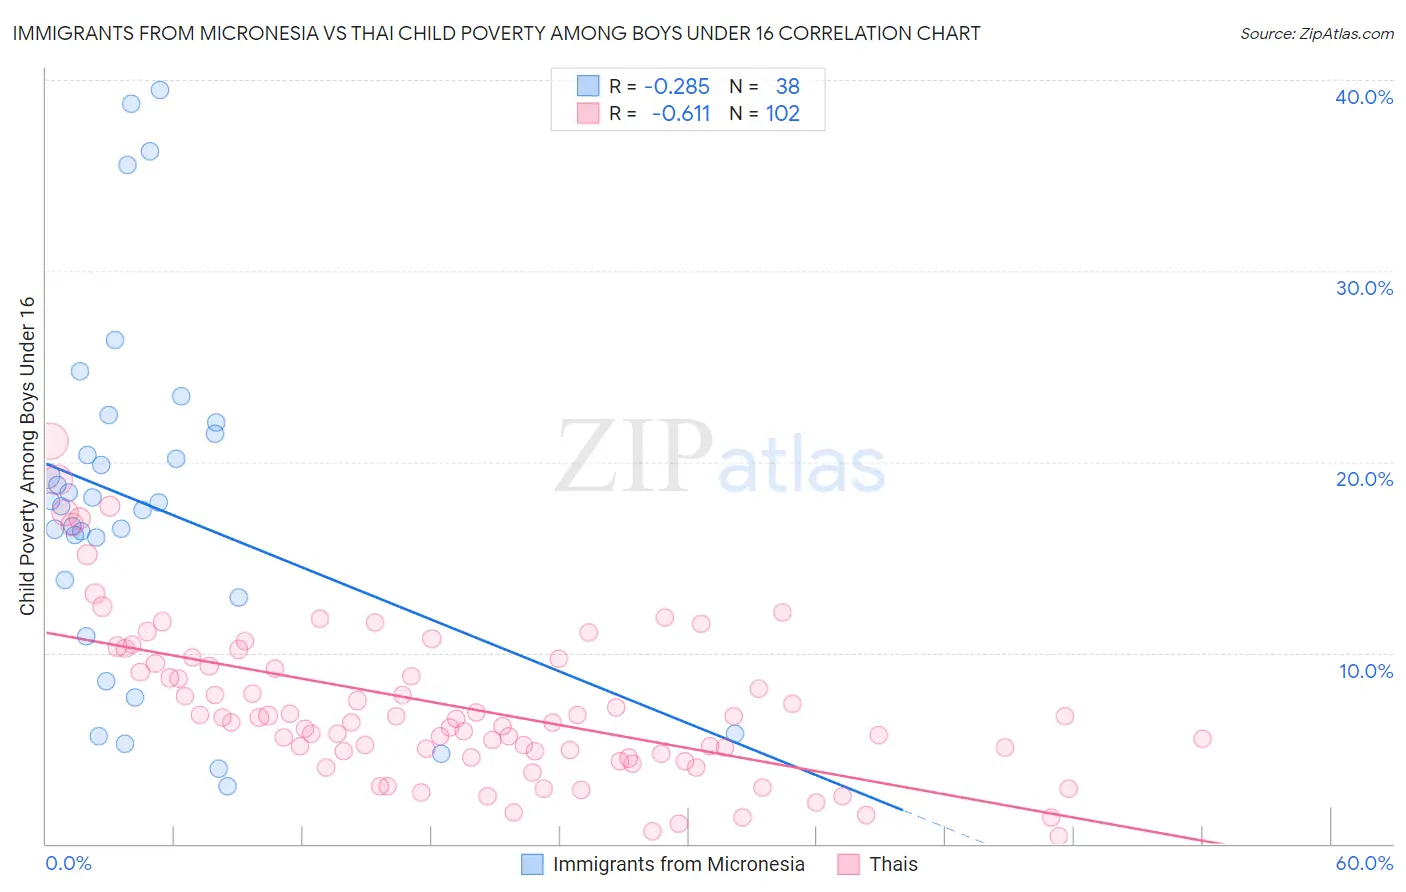
Immigrants from Micronesia vs Thai Child Poverty Among Boys Under 16 Correlation Chart

The statistical analysis conducted on geographies consisting of 61,480,670 people shows a weak negative correlation between the proportion of Immigrants from Micronesia and poverty level among boys under the age of 16 in the United States with a correlation coefficient (R) of -0.285 and weighted average of 18.3%. Similarly, the statistical analysis conducted on geographies consisting of 465,293,416 people shows a significant negative correlation between the proportion of Thais and poverty level among boys under the age of 16 in the United States with a correlation coefficient (R) of -0.611 and weighted average of 11.7%, a difference of 56.5%.
Immigrants from Micronesia vs Thai Child Poverty Among Boys Under 16

Child Poverty Among Boys Under 16 Correlation Summary

MeasurementImmigrants from MicronesiaThai
Minimum3.0%0.37%
Maximum39.5%21.1%
Range36.4%20.7%
Mean17.8%7.2%
Median17.8%6.4%
Interquartile 25% (IQ1)12.9%4.7%
Interquartile 75% (IQ3)21.5%9.4%
Interquartile Range (IQR)8.6%4.7%
Standard Deviation (Sample)9.2%4.1%
Standard Deviation (Population)9.1%4.1%

Similar Demographics by Child Poverty Among Boys Under 16

Demographics Similar to Immigrants from Micronesia by Child Poverty Among Boys Under 16

In terms of child poverty among boys under 16, the demographic groups most similar to Immigrants from Micronesia are Fijian (18.3%, a difference of 0.0%), Nonimmigrants (18.2%, a difference of 0.52%), Nicaraguan (18.4%, a difference of 0.53%), Marshallese (18.4%, a difference of 0.73%), and Bermudan (18.1%, a difference of 0.85%).
DemographicsRating | RankChild Poverty Among Boys Under 16
Pennsylvania Germans
3.9
/100
|
#222
Tragic
17.9%
Cubans
3.8
/100
|
#223
Tragic
17.9%
Nepalese
3.2
/100
|
#224
Tragic
18.0%
Inupiat
2.7
/100
|
#225
Tragic
18.1%
Immigrants | Africa
2.6
/100
|
#226
Tragic
18.1%
Bermudans
2.5
/100
|
#227
Tragic
18.1%
Immigrants | Nonimmigrants
2.2
/100
|
#228
Tragic
18.2%
Immigrants | Micronesia
1.8
/100
|
#229
Tragic
18.3%
Fijians
1.8
/100
|
#230
Tragic
18.3%
Nicaraguans
1.4
/100
|
#231
Tragic
18.4%
Marshallese
1.3
/100
|
#232
Tragic
18.4%
Immigrants | Nigeria
1.2
/100
|
#233
Tragic
18.4%
Nigerians
1.1
/100
|
#234
Tragic
18.5%
Americans
0.9
/100
|
#235
Tragic
18.6%
Sudanese
0.9
/100
|
#236
Tragic
18.6%

Demographics Similar to Thais by Child Poverty Among Boys Under 16

In terms of child poverty among boys under 16, the demographic groups most similar to Thais are Chinese (11.9%, a difference of 1.6%), Immigrants from Hong Kong (12.3%, a difference of 4.9%), Filipino (11.1%, a difference of 5.1%), Immigrants from Taiwan (11.0%, a difference of 5.9%), and Iranian (12.4%, a difference of 6.6%).
DemographicsRating | RankChild Poverty Among Boys Under 16
Immigrants | India
100.0
/100
|
#1
Exceptional
10.9%
Immigrants | Taiwan
100.0
/100
|
#2
Exceptional
11.0%
Filipinos
100.0
/100
|
#3
Exceptional
11.1%
Thais
100.0
/100
|
#4
Exceptional
11.7%
Chinese
100.0
/100
|
#5
Exceptional
11.9%
Immigrants | Hong Kong
100.0
/100
|
#6
Exceptional
12.3%
Iranians
100.0
/100
|
#7
Exceptional
12.4%
Immigrants | Singapore
100.0
/100
|
#8
Exceptional
12.5%
Immigrants | Iran
100.0
/100
|
#9
Exceptional
12.5%
Bhutanese
100.0
/100
|
#10
Exceptional
12.6%
Immigrants | South Central Asia
100.0
/100
|
#11
Exceptional
12.7%
Burmese
99.9
/100
|
#12
Exceptional
13.0%
Immigrants | Korea
99.9
/100
|
#13
Exceptional
13.0%
Immigrants | Ireland
99.9
/100
|
#14
Exceptional
13.1%
Immigrants | Japan
99.9
/100
|
#15
Exceptional
13.1%