Immigrants from Romania vs Colville Seniors Poverty Over the Age of 75
COMPARE
Immigrants from Romania
Colville
Seniors Poverty Over the Age of 75
Seniors Poverty Over the Age of 75 Comparison
Immigrants from Romania
Colville
11.9%
SENIORS POVERTY OVER THE AGE OF 75
72.6/ 100
METRIC RATING
138th/ 347
METRIC RANK
15.2%
SENIORS POVERTY OVER THE AGE OF 75
0.0/ 100
METRIC RATING
292nd/ 347
METRIC RANK
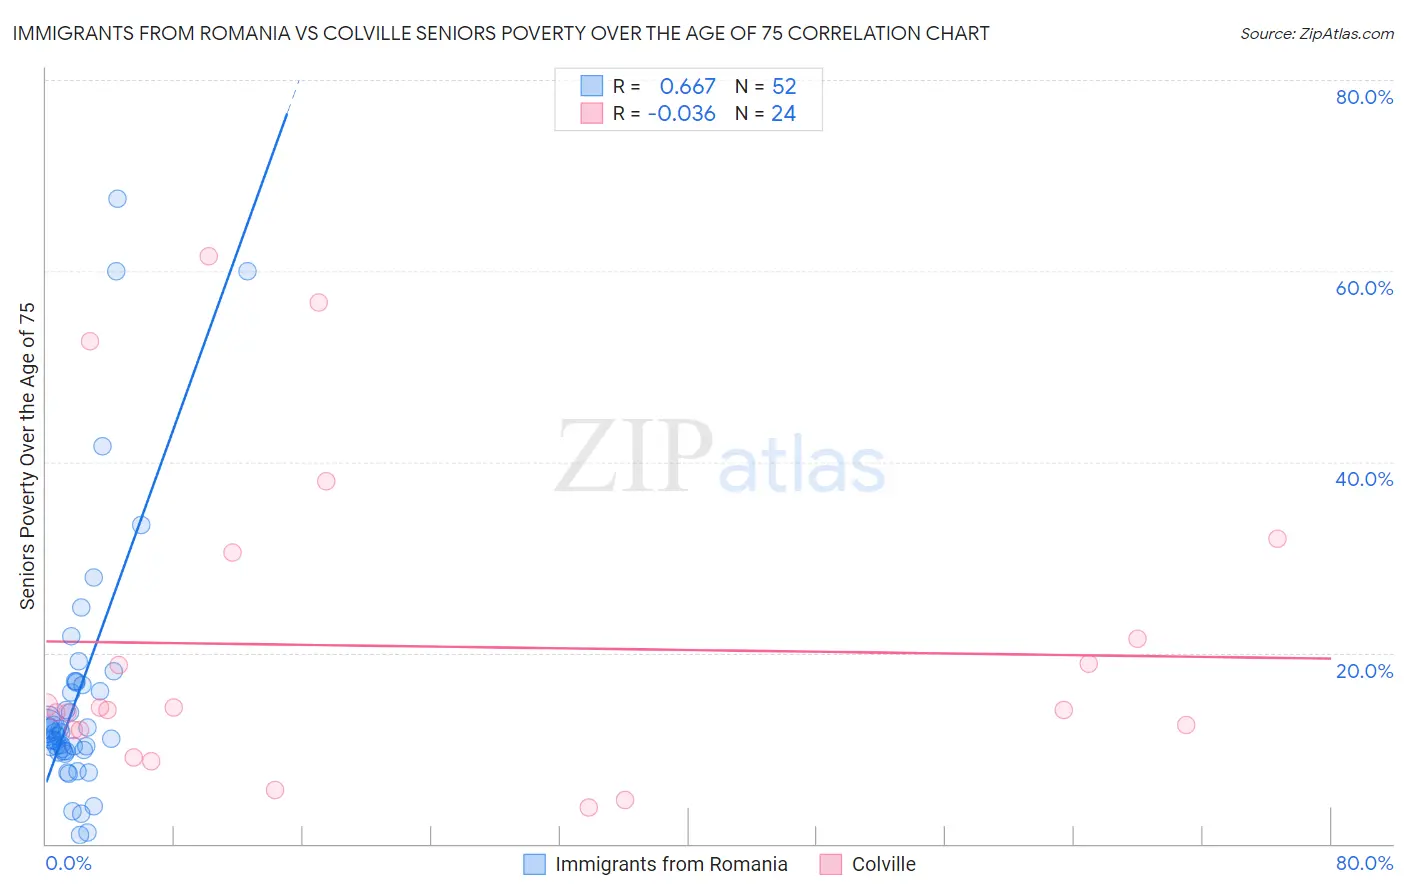
Immigrants from Romania vs Colville Seniors Poverty Over the Age of 75 Correlation Chart
The statistical analysis conducted on geographies consisting of 255,271,790 people shows a significant positive correlation between the proportion of Immigrants from Romania and poverty level among seniors over the age of 75 in the United States with a correlation coefficient (R) of 0.667 and weighted average of 11.9%. Similarly, the statistical analysis conducted on geographies consisting of 34,564,944 people shows no correlation between the proportion of Colville and poverty level among seniors over the age of 75 in the United States with a correlation coefficient (R) of -0.036 and weighted average of 15.2%, a difference of 27.4%.
Seniors Poverty Over the Age of 75 Correlation Summary
| Measurement | Immigrants from Romania | Colville |
| Minimum | 0.92% | 3.7% |
| Maximum | 67.5% | 61.5% |
| Range | 66.6% | 57.8% |
| Mean | 15.7% | 20.7% |
| Median | 11.7% | 14.1% |
| Interquartile 25% (IQ1) | 9.8% | 11.9% |
| Interquartile 75% (IQ3) | 16.8% | 26.0% |
| Interquartile Range (IQR) | 7.0% | 14.1% |
| Standard Deviation (Sample) | 13.7% | 16.3% |
| Standard Deviation (Population) | 13.6% | 15.9% |
Similar Demographics by Seniors Poverty Over the Age of 75
Demographics Similar to Immigrants from Romania by Seniors Poverty Over the Age of 75
In terms of seniors poverty over the age of 75, the demographic groups most similar to Immigrants from Romania are Immigrants from Kenya (11.9%, a difference of 0.010%), Immigrants from Pakistan (12.0%, a difference of 0.080%), Immigrants from Cameroon (12.0%, a difference of 0.090%), Immigrants from Laos (12.0%, a difference of 0.12%), and Immigrants from Moldova (11.9%, a difference of 0.16%).
| Demographics | Rating | Rank | Seniors Poverty Over the Age of 75 |
| Immigrants | Western Europe | 79.6 /100 | #131 | Good 11.9% |
| Lebanese | 78.3 /100 | #132 | Good 11.9% |
| Immigrants | Sierra Leone | 77.6 /100 | #133 | Good 11.9% |
| Ugandans | 77.1 /100 | #134 | Good 11.9% |
| Immigrants | Ireland | 76.2 /100 | #135 | Good 11.9% |
| Immigrants | Philippines | 75.0 /100 | #136 | Good 11.9% |
| Immigrants | Moldova | 74.1 /100 | #137 | Good 11.9% |
| Immigrants | Romania | 72.6 /100 | #138 | Good 11.9% |
| Immigrants | Kenya | 72.6 /100 | #139 | Good 11.9% |
| Immigrants | Pakistan | 71.9 /100 | #140 | Good 12.0% |
| Immigrants | Cameroon | 71.7 /100 | #141 | Good 12.0% |
| Immigrants | Laos | 71.5 /100 | #142 | Good 12.0% |
| Americans | 71.0 /100 | #143 | Good 12.0% |
| Hmong | 70.8 /100 | #144 | Good 12.0% |
| Immigrants | Belgium | 70.8 /100 | #145 | Good 12.0% |
Demographics Similar to Colville by Seniors Poverty Over the Age of 75
In terms of seniors poverty over the age of 75, the demographic groups most similar to Colville are Paiute (15.2%, a difference of 0.18%), Immigrants from the Azores (15.2%, a difference of 0.20%), Immigrants from Belize (15.2%, a difference of 0.22%), Apache (15.3%, a difference of 0.40%), and Jamaican (15.1%, a difference of 0.48%).
| Demographics | Rating | Rank | Seniors Poverty Over the Age of 75 |
| Immigrants | Mexico | 0.0 /100 | #285 | Tragic 14.9% |
| Immigrants | Central America | 0.0 /100 | #286 | Tragic 15.0% |
| Immigrants | Guatemala | 0.0 /100 | #287 | Tragic 15.1% |
| Jamaicans | 0.0 /100 | #288 | Tragic 15.1% |
| Immigrants | Belize | 0.0 /100 | #289 | Tragic 15.2% |
| Immigrants | Azores | 0.0 /100 | #290 | Tragic 15.2% |
| Paiute | 0.0 /100 | #291 | Tragic 15.2% |
| Colville | 0.0 /100 | #292 | Tragic 15.2% |
| Apache | 0.0 /100 | #293 | Tragic 15.3% |
| Immigrants | Jamaica | 0.0 /100 | #294 | Tragic 15.3% |
| U.S. Virgin Islanders | 0.0 /100 | #295 | Tragic 15.4% |
| Yuman | 0.0 /100 | #296 | Tragic 15.4% |
| Hondurans | 0.0 /100 | #297 | Tragic 15.4% |
| Natives/Alaskans | 0.0 /100 | #298 | Tragic 15.5% |
| Spanish American Indians | 0.0 /100 | #299 | Tragic 15.5% |