Jordanian vs Estonian Female Poverty Among 25-34 Year Olds
COMPARE
Jordanian
Estonian
Female Poverty Among 25-34 Year Olds
Female Poverty Among 25-34 Year Olds Comparison
Jordanians
Estonians
12.1%
FEMALE POVERTY AMONG 25-34 YEAR OLDS
99.4/ 100
METRIC RATING
57th/ 347
METRIC RANK
12.3%
FEMALE POVERTY AMONG 25-34 YEAR OLDS
98.9/ 100
METRIC RATING
75th/ 347
METRIC RANK
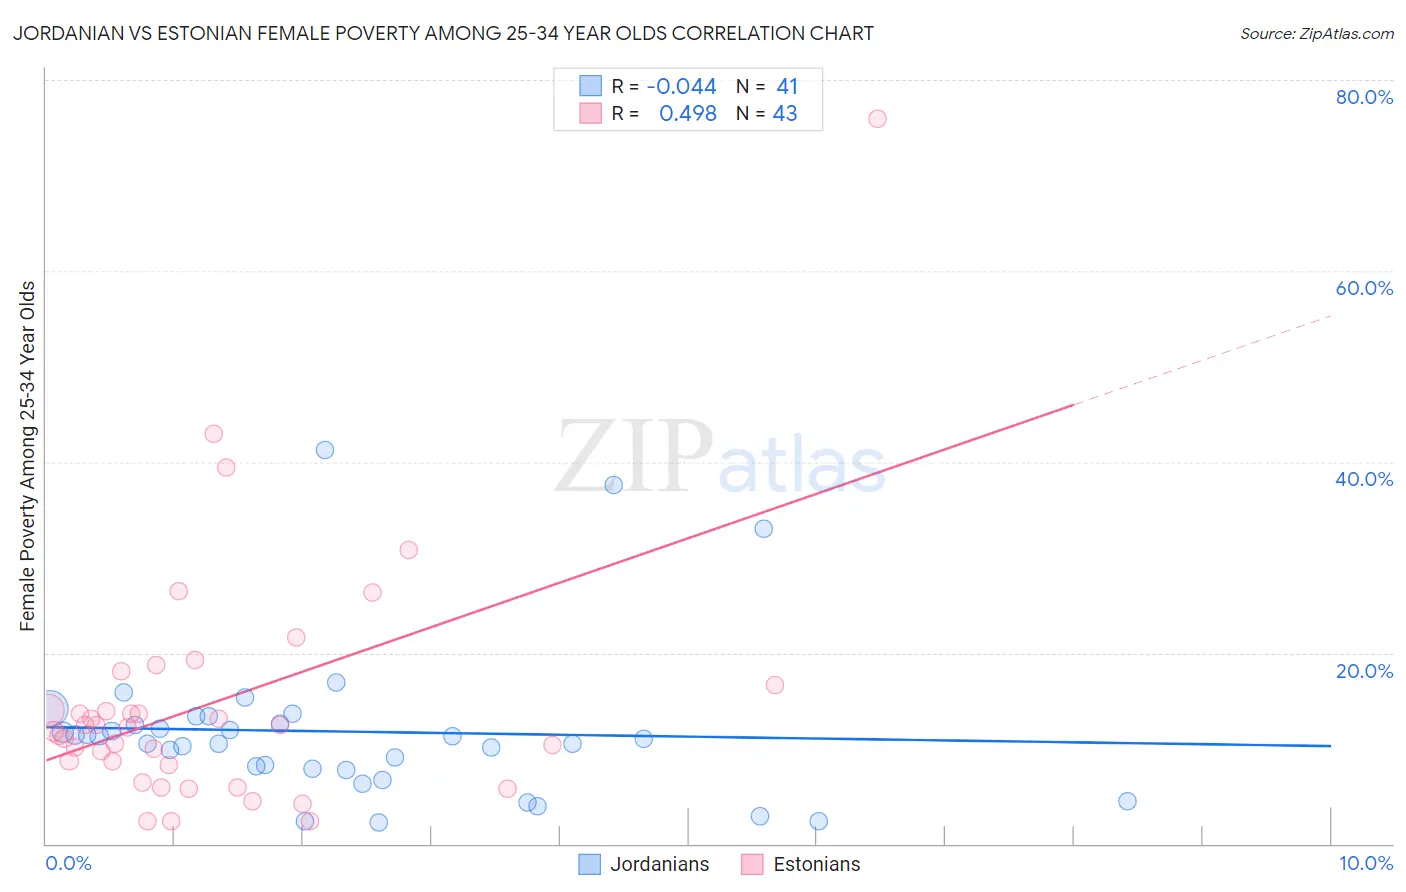
Jordanian vs Estonian Female Poverty Among 25-34 Year Olds Correlation Chart
The statistical analysis conducted on geographies consisting of 165,610,888 people shows no correlation between the proportion of Jordanians and poverty level among females between the ages 25 and 34 in the United States with a correlation coefficient (R) of -0.044 and weighted average of 12.1%. Similarly, the statistical analysis conducted on geographies consisting of 122,488,536 people shows a moderate positive correlation between the proportion of Estonians and poverty level among females between the ages 25 and 34 in the United States with a correlation coefficient (R) of 0.498 and weighted average of 12.3%, a difference of 1.7%.
Female Poverty Among 25-34 Year Olds Correlation Summary
| Measurement | Jordanian | Estonian |
| Minimum | 2.3% | 2.3% |
| Maximum | 41.2% | 76.0% |
| Range | 39.0% | 73.7% |
| Mean | 11.7% | 14.8% |
| Median | 11.0% | 12.2% |
| Interquartile 25% (IQ1) | 7.8% | 8.2% |
| Interquartile 75% (IQ3) | 13.0% | 16.7% |
| Interquartile Range (IQR) | 5.2% | 8.4% |
| Standard Deviation (Sample) | 8.2% | 13.0% |
| Standard Deviation (Population) | 8.1% | 12.9% |
Demographics Similar to Jordanians and Estonians by Female Poverty Among 25-34 Year Olds
In terms of female poverty among 25-34 year olds, the demographic groups most similar to Jordanians are Luxembourger (12.1%, a difference of 0.020%), Immigrants from Romania (12.1%, a difference of 0.21%), Russian (12.1%, a difference of 0.21%), Immigrants from Northern Europe (12.1%, a difference of 0.29%), and Immigrants from Czechoslovakia (12.1%, a difference of 0.32%). Similarly, the demographic groups most similar to Estonians are Immigrants from Sweden (12.3%, a difference of 0.050%), Greek (12.3%, a difference of 0.060%), Immigrants from Vietnam (12.3%, a difference of 0.080%), Lithuanian (12.2%, a difference of 0.39%), and Immigrants from Scotland (12.2%, a difference of 0.44%).
| Demographics | Rating | Rank | Female Poverty Among 25-34 Year Olds |
| Luxembourgers | 99.5 /100 | #56 | Exceptional 12.1% |
| Jordanians | 99.4 /100 | #57 | Exceptional 12.1% |
| Immigrants | Romania | 99.4 /100 | #58 | Exceptional 12.1% |
| Russians | 99.4 /100 | #59 | Exceptional 12.1% |
| Immigrants | Northern Europe | 99.4 /100 | #60 | Exceptional 12.1% |
| Immigrants | Czechoslovakia | 99.4 /100 | #61 | Exceptional 12.1% |
| Immigrants | Moldova | 99.3 /100 | #62 | Exceptional 12.1% |
| Soviet Union | 99.3 /100 | #63 | Exceptional 12.1% |
| Immigrants | Russia | 99.2 /100 | #64 | Exceptional 12.2% |
| Armenians | 99.2 /100 | #65 | Exceptional 12.2% |
| Immigrants | Europe | 99.2 /100 | #66 | Exceptional 12.2% |
| Laotians | 99.2 /100 | #67 | Exceptional 12.2% |
| Sri Lankans | 99.1 /100 | #68 | Exceptional 12.2% |
| Immigrants | Lebanon | 99.1 /100 | #69 | Exceptional 12.2% |
| Immigrants | Belgium | 99.1 /100 | #70 | Exceptional 12.2% |
| Immigrants | Scotland | 99.1 /100 | #71 | Exceptional 12.2% |
| Lithuanians | 99.1 /100 | #72 | Exceptional 12.2% |
| Immigrants | Vietnam | 98.9 /100 | #73 | Exceptional 12.3% |
| Immigrants | Sweden | 98.9 /100 | #74 | Exceptional 12.3% |
| Estonians | 98.9 /100 | #75 | Exceptional 12.3% |
| Greeks | 98.9 /100 | #76 | Exceptional 12.3% |