Jordanian vs Barbadian Receiving Food Stamps
COMPARE
Jordanian
Barbadian
Receiving Food Stamps
Receiving Food Stamps Comparison
Jordanians
Barbadians
10.2%
RECEIVING FOOD STAMPS
97.9/ 100
METRIC RATING
91st/ 347
METRIC RANK
16.5%
RECEIVING FOOD STAMPS
0.0/ 100
METRIC RATING
308th/ 347
METRIC RANK
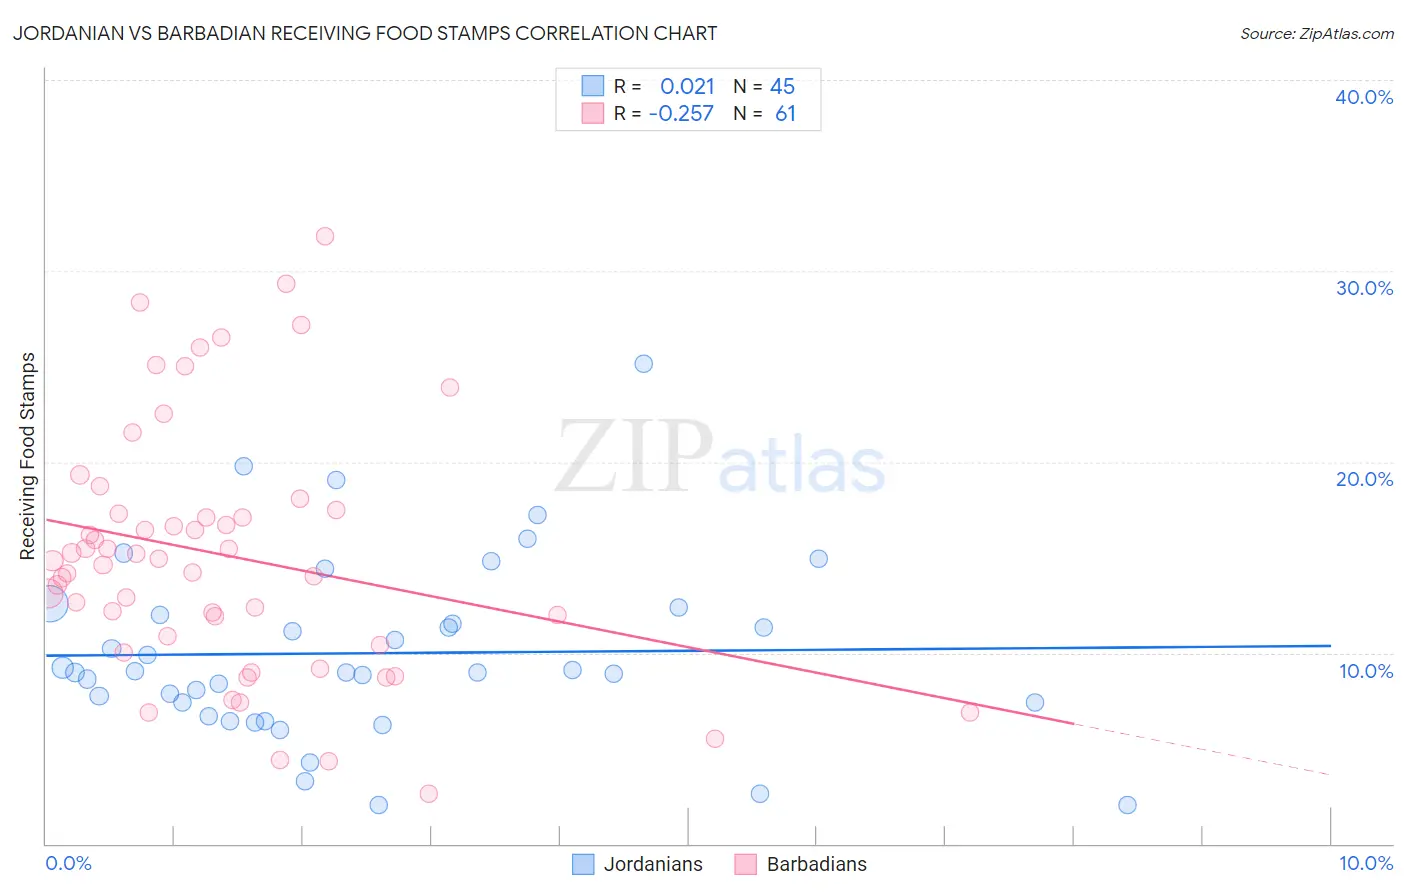
Jordanian vs Barbadian Receiving Food Stamps Correlation Chart
The statistical analysis conducted on geographies consisting of 166,269,073 people shows no correlation between the proportion of Jordanians and percentage of population receiving government assistance and/or food stamps in the United States with a correlation coefficient (R) of 0.021 and weighted average of 10.2%. Similarly, the statistical analysis conducted on geographies consisting of 141,159,884 people shows a weak negative correlation between the proportion of Barbadians and percentage of population receiving government assistance and/or food stamps in the United States with a correlation coefficient (R) of -0.257 and weighted average of 16.5%, a difference of 62.4%.
Receiving Food Stamps Correlation Summary
| Measurement | Jordanian | Barbadian |
| Minimum | 2.0% | 2.6% |
| Maximum | 25.2% | 31.8% |
| Range | 23.2% | 29.2% |
| Mean | 10.0% | 15.1% |
| Median | 9.0% | 14.8% |
| Interquartile 25% (IQ1) | 7.0% | 10.6% |
| Interquartile 75% (IQ3) | 12.2% | 17.4% |
| Interquartile Range (IQR) | 5.2% | 6.8% |
| Standard Deviation (Sample) | 4.8% | 6.5% |
| Standard Deviation (Population) | 4.7% | 6.5% |
Similar Demographics by Receiving Food Stamps
Demographics Similar to Jordanians by Receiving Food Stamps
In terms of receiving food stamps, the demographic groups most similar to Jordanians are Irish (10.2%, a difference of 0.0%), Finnish (10.2%, a difference of 0.040%), Belgian (10.2%, a difference of 0.39%), Immigrants from France (10.1%, a difference of 0.89%), and Immigrants from Greece (10.3%, a difference of 0.91%).
| Demographics | Rating | Rank | Receiving Food Stamps |
| Immigrants | Israel | 98.5 /100 | #84 | Exceptional 10.0% |
| Immigrants | Romania | 98.5 /100 | #85 | Exceptional 10.0% |
| Immigrants | Norway | 98.4 /100 | #86 | Exceptional 10.0% |
| Egyptians | 98.4 /100 | #87 | Exceptional 10.0% |
| Immigrants | Kuwait | 98.4 /100 | #88 | Exceptional 10.0% |
| Immigrants | France | 98.3 /100 | #89 | Exceptional 10.1% |
| Finns | 97.9 /100 | #90 | Exceptional 10.2% |
| Jordanians | 97.9 /100 | #91 | Exceptional 10.2% |
| Irish | 97.9 /100 | #92 | Exceptional 10.2% |
| Belgians | 97.7 /100 | #93 | Exceptional 10.2% |
| Immigrants | Greece | 97.4 /100 | #94 | Exceptional 10.3% |
| Basques | 97.4 /100 | #95 | Exceptional 10.3% |
| Welsh | 97.3 /100 | #96 | Exceptional 10.3% |
| Czechoslovakians | 97.2 /100 | #97 | Exceptional 10.3% |
| Immigrants | Egypt | 97.1 /100 | #98 | Exceptional 10.3% |
Demographics Similar to Barbadians by Receiving Food Stamps
In terms of receiving food stamps, the demographic groups most similar to Barbadians are U.S. Virgin Islander (16.5%, a difference of 0.24%), Houma (16.5%, a difference of 0.26%), Jamaican (16.4%, a difference of 0.55%), Immigrants from the Azores (16.4%, a difference of 0.62%), and Immigrants from Barbados (16.6%, a difference of 0.79%).
| Demographics | Rating | Rank | Receiving Food Stamps |
| Trinidadians and Tobagonians | 0.0 /100 | #301 | Tragic 16.0% |
| Immigrants | West Indies | 0.0 /100 | #302 | Tragic 16.1% |
| Nicaraguans | 0.0 /100 | #303 | Tragic 16.1% |
| West Indians | 0.0 /100 | #304 | Tragic 16.3% |
| Immigrants | Azores | 0.0 /100 | #305 | Tragic 16.4% |
| Jamaicans | 0.0 /100 | #306 | Tragic 16.4% |
| Houma | 0.0 /100 | #307 | Tragic 16.5% |
| Barbadians | 0.0 /100 | #308 | Tragic 16.5% |
| U.S. Virgin Islanders | 0.0 /100 | #309 | Tragic 16.5% |
| Immigrants | Barbados | 0.0 /100 | #310 | Tragic 16.6% |
| Guyanese | 0.0 /100 | #311 | Tragic 16.7% |
| Sioux | 0.0 /100 | #312 | Tragic 16.8% |
| Immigrants | Jamaica | 0.0 /100 | #313 | Tragic 16.9% |
| Immigrants | Guyana | 0.0 /100 | #314 | Tragic 16.9% |
| Bahamians | 0.0 /100 | #315 | Tragic 17.0% |