Paiute vs Immigrants from Pakistan Child Poverty Under the Age of 16
COMPARE
Paiute
Immigrants from Pakistan
Child Poverty Under the Age of 16
Child Poverty Under the Age of 16 Comparison
Paiute
Immigrants from Pakistan
22.4%
CHILD POVERTY UNDER THE AGE OF 16
0.0/ 100
METRIC RATING
323rd/ 347
METRIC RANK
14.1%
CHILD POVERTY UNDER THE AGE OF 16
98.6/ 100
METRIC RATING
58th/ 347
METRIC RANK
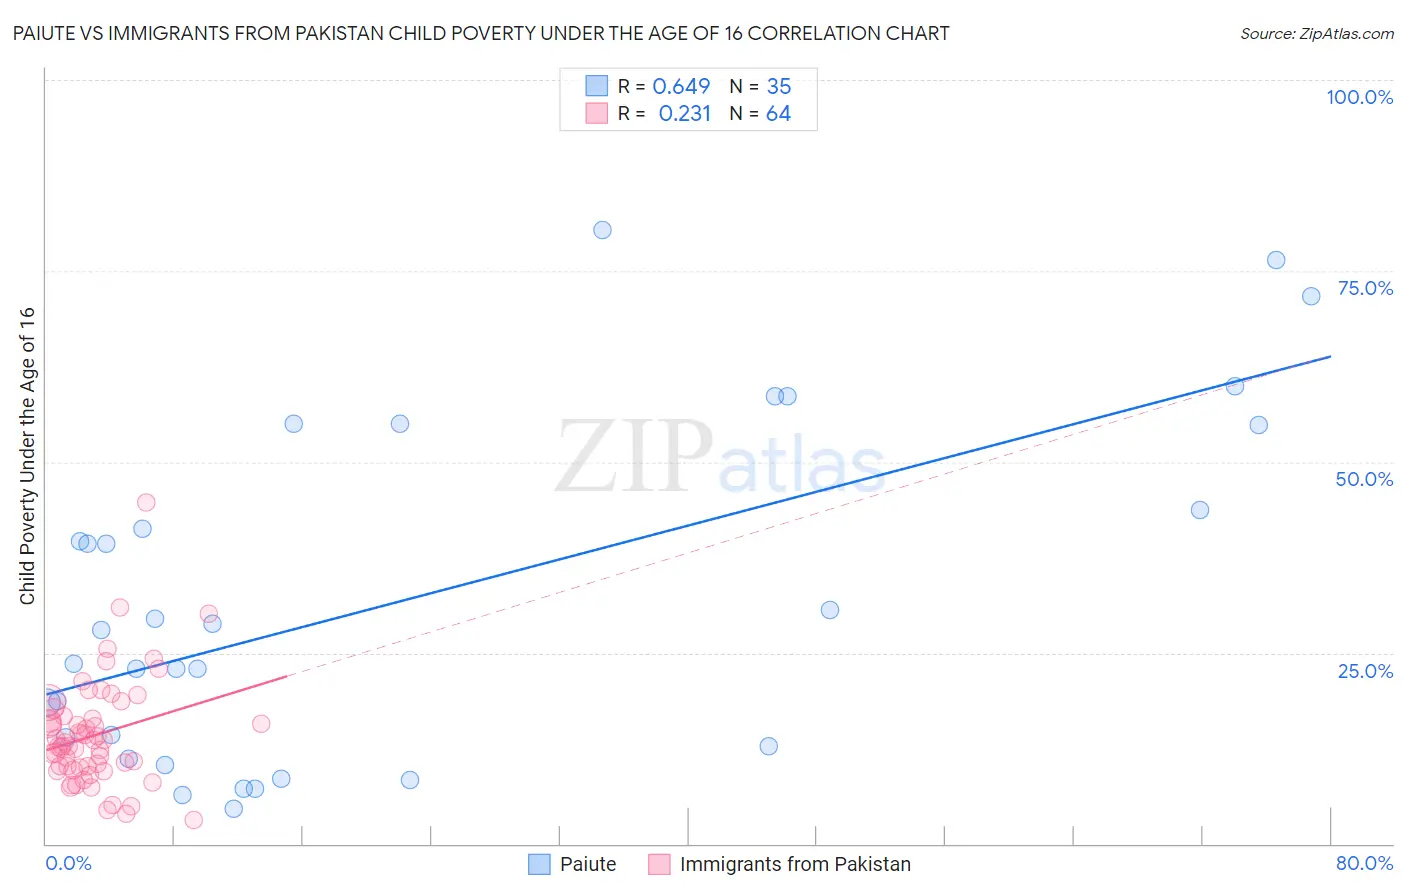
Paiute vs Immigrants from Pakistan Child Poverty Under the Age of 16 Correlation Chart
The statistical analysis conducted on geographies consisting of 58,234,702 people shows a significant positive correlation between the proportion of Paiute and poverty level among children under the age of 16 in the United States with a correlation coefficient (R) of 0.649 and weighted average of 22.4%. Similarly, the statistical analysis conducted on geographies consisting of 282,211,286 people shows a weak positive correlation between the proportion of Immigrants from Pakistan and poverty level among children under the age of 16 in the United States with a correlation coefficient (R) of 0.231 and weighted average of 14.1%, a difference of 58.7%.
Child Poverty Under the Age of 16 Correlation Summary
| Measurement | Paiute | Immigrants from Pakistan |
| Minimum | 4.6% | 3.1% |
| Maximum | 80.4% | 44.6% |
| Range | 75.7% | 41.6% |
| Mean | 32.1% | 14.2% |
| Median | 28.0% | 13.0% |
| Interquartile 25% (IQ1) | 12.7% | 10.0% |
| Interquartile 75% (IQ3) | 54.8% | 16.5% |
| Interquartile Range (IQR) | 42.1% | 6.5% |
| Standard Deviation (Sample) | 22.0% | 7.0% |
| Standard Deviation (Population) | 21.7% | 7.0% |
Similar Demographics by Child Poverty Under the Age of 16
Demographics Similar to Paiute by Child Poverty Under the Age of 16
In terms of child poverty under the age of 16, the demographic groups most similar to Paiute are Central American Indian (22.5%, a difference of 0.31%), Immigrants from Congo (22.5%, a difference of 0.45%), Honduran (22.2%, a difference of 1.0%), Kiowa (22.2%, a difference of 1.2%), and Immigrants from Honduras (22.7%, a difference of 1.3%).
| Demographics | Rating | Rank | Child Poverty Under the Age of 16 |
| Africans | 0.0 /100 | #316 | Tragic 21.7% |
| Immigrants | Dominica | 0.0 /100 | #317 | Tragic 21.9% |
| U.S. Virgin Islanders | 0.0 /100 | #318 | Tragic 22.0% |
| Yakama | 0.0 /100 | #319 | Tragic 22.1% |
| Cajuns | 0.0 /100 | #320 | Tragic 22.1% |
| Kiowa | 0.0 /100 | #321 | Tragic 22.2% |
| Hondurans | 0.0 /100 | #322 | Tragic 22.2% |
| Paiute | 0.0 /100 | #323 | Tragic 22.4% |
| Central American Indians | 0.0 /100 | #324 | Tragic 22.5% |
| Immigrants | Congo | 0.0 /100 | #325 | Tragic 22.5% |
| Immigrants | Honduras | 0.0 /100 | #326 | Tragic 22.7% |
| Menominee | 0.0 /100 | #327 | Tragic 23.0% |
| Colville | 0.0 /100 | #328 | Tragic 23.0% |
| Dominicans | 0.0 /100 | #329 | Tragic 23.8% |
| Natives/Alaskans | 0.0 /100 | #330 | Tragic 23.8% |
Demographics Similar to Immigrants from Pakistan by Child Poverty Under the Age of 16
In terms of child poverty under the age of 16, the demographic groups most similar to Immigrants from Pakistan are Scandinavian (14.1%, a difference of 0.010%), Immigrants from Belgium (14.1%, a difference of 0.020%), Immigrants from Serbia (14.1%, a difference of 0.11%), Immigrants from Austria (14.2%, a difference of 0.20%), and Immigrants from Sweden (14.2%, a difference of 0.24%).
| Demographics | Rating | Rank | Child Poverty Under the Age of 16 |
| Immigrants | Greece | 99.1 /100 | #51 | Exceptional 13.9% |
| Poles | 98.9 /100 | #52 | Exceptional 14.0% |
| Immigrants | Israel | 98.8 /100 | #53 | Exceptional 14.1% |
| Tsimshian | 98.8 /100 | #54 | Exceptional 14.1% |
| Immigrants | Indonesia | 98.7 /100 | #55 | Exceptional 14.1% |
| Immigrants | Serbia | 98.7 /100 | #56 | Exceptional 14.1% |
| Immigrants | Belgium | 98.6 /100 | #57 | Exceptional 14.1% |
| Immigrants | Pakistan | 98.6 /100 | #58 | Exceptional 14.1% |
| Scandinavians | 98.6 /100 | #59 | Exceptional 14.1% |
| Immigrants | Austria | 98.5 /100 | #60 | Exceptional 14.2% |
| Immigrants | Sweden | 98.5 /100 | #61 | Exceptional 14.2% |
| Zimbabweans | 98.5 /100 | #62 | Exceptional 14.2% |
| Immigrants | Europe | 98.4 /100 | #63 | Exceptional 14.2% |
| Immigrants | Romania | 98.3 /100 | #64 | Exceptional 14.2% |
| Immigrants | Philippines | 98.2 /100 | #65 | Exceptional 14.3% |