Iroquois vs Nepalese Child Poverty Under the Age of 5
COMPARE
Iroquois
Nepalese
Child Poverty Under the Age of 5
Child Poverty Under the Age of 5 Comparison
Iroquois
Nepalese
22.0%
CHILD POVERTY UNDER THE AGE OF 5
0.0/ 100
METRIC RATING
302nd/ 347
METRIC RANK
18.3%
CHILD POVERTY UNDER THE AGE OF 5
8.7/ 100
METRIC RATING
212th/ 347
METRIC RANK
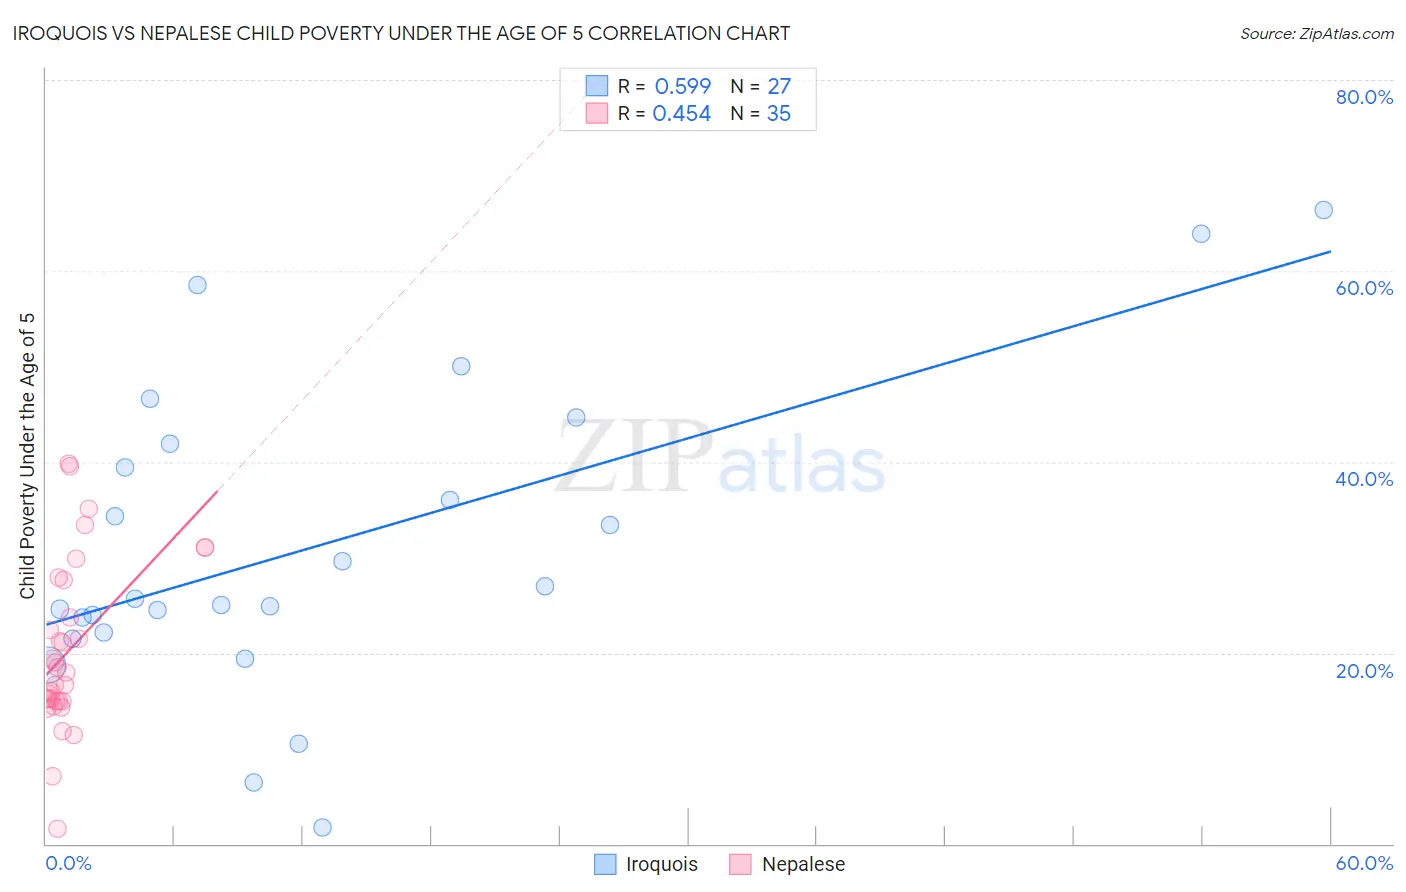
Iroquois vs Nepalese Child Poverty Under the Age of 5 Correlation Chart
The statistical analysis conducted on geographies consisting of 202,992,045 people shows a substantial positive correlation between the proportion of Iroquois and poverty level among children under the age of 5 in the United States with a correlation coefficient (R) of 0.599 and weighted average of 22.0%. Similarly, the statistical analysis conducted on geographies consisting of 24,301,294 people shows a moderate positive correlation between the proportion of Nepalese and poverty level among children under the age of 5 in the United States with a correlation coefficient (R) of 0.454 and weighted average of 18.3%, a difference of 20.4%.
Child Poverty Under the Age of 5 Correlation Summary
| Measurement | Iroquois | Nepalese |
| Minimum | 1.6% | 1.6% |
| Maximum | 66.3% | 39.8% |
| Range | 64.7% | 38.2% |
| Mean | 31.3% | 20.3% |
| Median | 25.7% | 18.0% |
| Interquartile 25% (IQ1) | 22.1% | 15.0% |
| Interquartile 75% (IQ3) | 41.9% | 27.7% |
| Interquartile Range (IQR) | 19.8% | 12.7% |
| Standard Deviation (Sample) | 16.1% | 8.8% |
| Standard Deviation (Population) | 15.8% | 8.7% |
Similar Demographics by Child Poverty Under the Age of 5
Demographics Similar to Iroquois by Child Poverty Under the Age of 5
In terms of child poverty under the age of 5, the demographic groups most similar to Iroquois are Inupiat (22.0%, a difference of 0.090%), Immigrants from Central America (22.0%, a difference of 0.17%), Immigrants from Guatemala (22.0%, a difference of 0.20%), Chickasaw (21.8%, a difference of 0.83%), and Alaskan Athabascan (21.8%, a difference of 0.83%).
| Demographics | Rating | Rank | Child Poverty Under the Age of 5 |
| Cherokee | 0.0 /100 | #295 | Tragic 21.7% |
| Yaqui | 0.0 /100 | #296 | Tragic 21.7% |
| Hispanics or Latinos | 0.0 /100 | #297 | Tragic 21.7% |
| Blackfeet | 0.0 /100 | #298 | Tragic 21.8% |
| Chickasaw | 0.0 /100 | #299 | Tragic 21.8% |
| Alaskan Athabascans | 0.0 /100 | #300 | Tragic 21.8% |
| Immigrants | Central America | 0.0 /100 | #301 | Tragic 22.0% |
| Iroquois | 0.0 /100 | #302 | Tragic 22.0% |
| Inupiat | 0.0 /100 | #303 | Tragic 22.0% |
| Immigrants | Guatemala | 0.0 /100 | #304 | Tragic 22.0% |
| Immigrants | Mexico | 0.0 /100 | #305 | Tragic 22.2% |
| Indonesians | 0.0 /100 | #306 | Tragic 22.3% |
| Immigrants | Bahamas | 0.0 /100 | #307 | Tragic 22.7% |
| Immigrants | Dominica | 0.0 /100 | #308 | Tragic 22.7% |
| Houma | 0.0 /100 | #309 | Tragic 22.7% |
Demographics Similar to Nepalese by Child Poverty Under the Age of 5
In terms of child poverty under the age of 5, the demographic groups most similar to Nepalese are Immigrants from Thailand (18.3%, a difference of 0.020%), Moroccan (18.2%, a difference of 0.21%), Panamanian (18.2%, a difference of 0.30%), Spanish (18.2%, a difference of 0.31%), and Scotch-Irish (18.2%, a difference of 0.32%).
| Demographics | Rating | Rank | Child Poverty Under the Age of 5 |
| Spaniards | 12.8 /100 | #205 | Poor 18.1% |
| Whites/Caucasians | 12.6 /100 | #206 | Poor 18.1% |
| Immigrants | Immigrants | 9.9 /100 | #207 | Tragic 18.2% |
| Scotch-Irish | 9.8 /100 | #208 | Tragic 18.2% |
| Spanish | 9.8 /100 | #209 | Tragic 18.2% |
| Panamanians | 9.7 /100 | #210 | Tragic 18.2% |
| Moroccans | 9.4 /100 | #211 | Tragic 18.2% |
| Nepalese | 8.7 /100 | #212 | Tragic 18.3% |
| Immigrants | Thailand | 8.6 /100 | #213 | Tragic 18.3% |
| Malaysians | 6.5 /100 | #214 | Tragic 18.4% |
| Immigrants | Panama | 6.0 /100 | #215 | Tragic 18.5% |
| Hmong | 5.0 /100 | #216 | Tragic 18.5% |
| Immigrants | Africa | 4.6 /100 | #217 | Tragic 18.6% |
| Delaware | 3.4 /100 | #218 | Tragic 18.7% |
| German Russians | 3.0 /100 | #219 | Tragic 18.8% |