Immigrants from Uruguay vs Nepalese Child Poverty Under the Age of 5
COMPARE
Immigrants from Uruguay
Nepalese
Child Poverty Under the Age of 5
Child Poverty Under the Age of 5 Comparison
Immigrants from Uruguay
Nepalese
17.7%
CHILD POVERTY UNDER THE AGE OF 5
27.8/ 100
METRIC RATING
192nd/ 347
METRIC RANK
18.3%
CHILD POVERTY UNDER THE AGE OF 5
8.7/ 100
METRIC RATING
212th/ 347
METRIC RANK
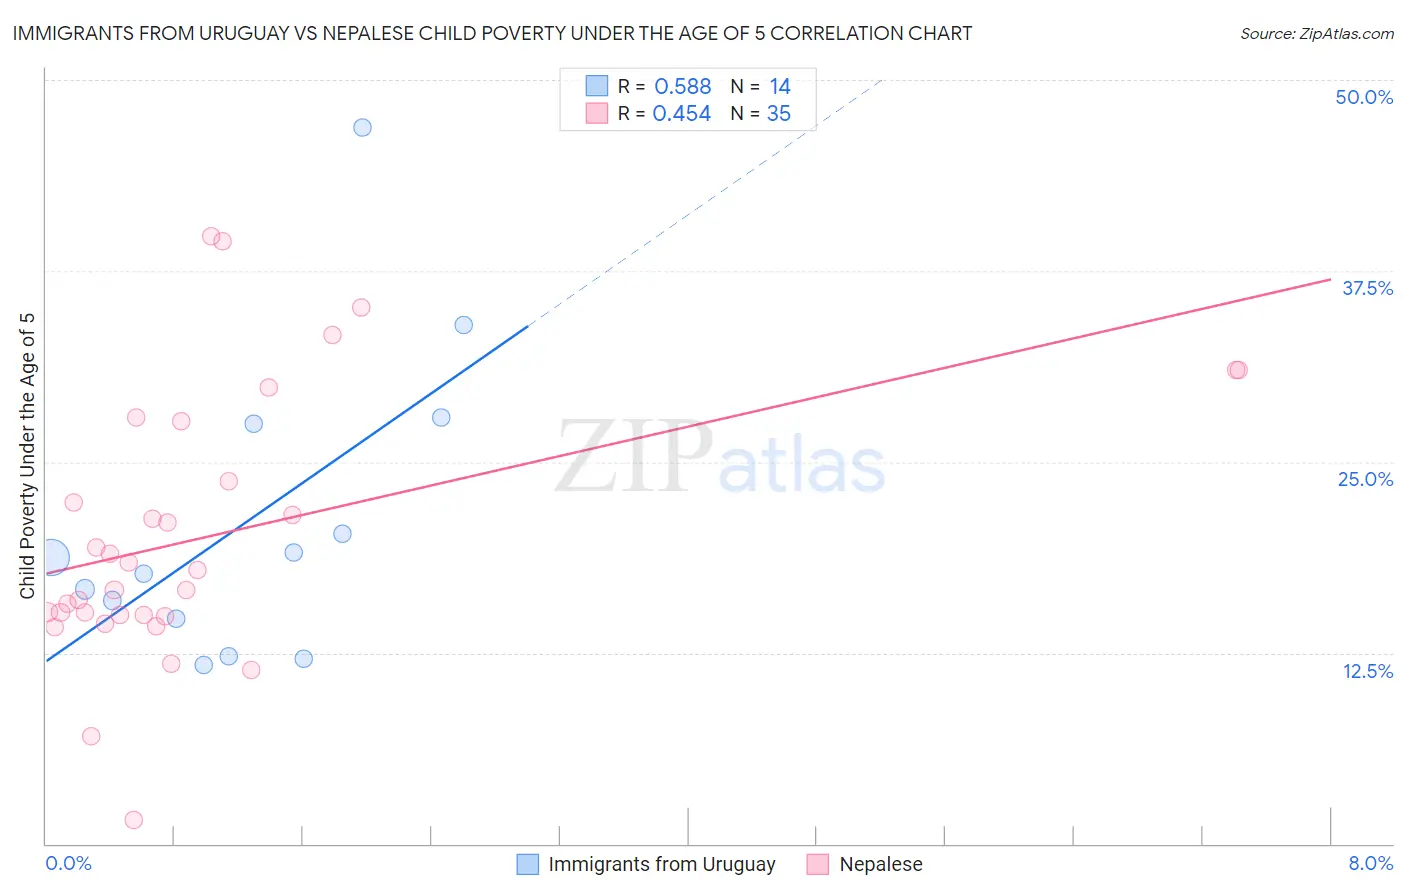
Immigrants from Uruguay vs Nepalese Child Poverty Under the Age of 5 Correlation Chart
The statistical analysis conducted on geographies consisting of 130,958,441 people shows a substantial positive correlation between the proportion of Immigrants from Uruguay and poverty level among children under the age of 5 in the United States with a correlation coefficient (R) of 0.588 and weighted average of 17.7%. Similarly, the statistical analysis conducted on geographies consisting of 24,301,294 people shows a moderate positive correlation between the proportion of Nepalese and poverty level among children under the age of 5 in the United States with a correlation coefficient (R) of 0.454 and weighted average of 18.3%, a difference of 3.5%.
Child Poverty Under the Age of 5 Correlation Summary
| Measurement | Immigrants from Uruguay | Nepalese |
| Minimum | 11.7% | 1.6% |
| Maximum | 46.9% | 39.8% |
| Range | 35.2% | 38.2% |
| Mean | 21.1% | 20.3% |
| Median | 18.2% | 18.0% |
| Interquartile 25% (IQ1) | 14.7% | 15.0% |
| Interquartile 75% (IQ3) | 27.5% | 27.7% |
| Interquartile Range (IQR) | 12.8% | 12.7% |
| Standard Deviation (Sample) | 9.9% | 8.8% |
| Standard Deviation (Population) | 9.5% | 8.7% |
Demographics Similar to Immigrants from Uruguay and Nepalese by Child Poverty Under the Age of 5
In terms of child poverty under the age of 5, the demographic groups most similar to Immigrants from Uruguay are Immigrants from Uganda (17.7%, a difference of 0.37%), French Canadian (17.7%, a difference of 0.43%), Sierra Leonean (17.7%, a difference of 0.49%), Immigrants from Portugal (17.8%, a difference of 0.77%), and Immigrants from Kenya (17.9%, a difference of 1.1%). Similarly, the demographic groups most similar to Nepalese are Moroccan (18.2%, a difference of 0.21%), Panamanian (18.2%, a difference of 0.30%), Spanish (18.2%, a difference of 0.31%), Scotch-Irish (18.2%, a difference of 0.32%), and Immigrants (18.2%, a difference of 0.33%).
| Demographics | Rating | Rank | Child Poverty Under the Age of 5 |
| Immigrants | Uruguay | 27.8 /100 | #192 | Fair 17.7% |
| Immigrants | Uganda | 25.0 /100 | #193 | Fair 17.7% |
| French Canadians | 24.6 /100 | #194 | Fair 17.7% |
| Sierra Leoneans | 24.1 /100 | #195 | Fair 17.7% |
| Immigrants | Portugal | 22.2 /100 | #196 | Fair 17.8% |
| Immigrants | Kenya | 20.0 /100 | #197 | Fair 17.9% |
| Celtics | 18.3 /100 | #198 | Poor 17.9% |
| Hungarians | 18.3 /100 | #199 | Poor 17.9% |
| Iraqis | 14.0 /100 | #200 | Poor 18.0% |
| Ugandans | 13.9 /100 | #201 | Poor 18.0% |
| Japanese | 13.8 /100 | #202 | Poor 18.1% |
| Immigrants | Cambodia | 13.7 /100 | #203 | Poor 18.1% |
| Immigrants | Eastern Africa | 13.4 /100 | #204 | Poor 18.1% |
| Spaniards | 12.8 /100 | #205 | Poor 18.1% |
| Whites/Caucasians | 12.6 /100 | #206 | Poor 18.1% |
| Immigrants | Immigrants | 9.9 /100 | #207 | Tragic 18.2% |
| Scotch-Irish | 9.8 /100 | #208 | Tragic 18.2% |
| Spanish | 9.8 /100 | #209 | Tragic 18.2% |
| Panamanians | 9.7 /100 | #210 | Tragic 18.2% |
| Moroccans | 9.4 /100 | #211 | Tragic 18.2% |
| Nepalese | 8.7 /100 | #212 | Tragic 18.3% |