Iroquois vs Immigrants from South Eastern Asia Child Poverty Under the Age of 16
COMPARE
Iroquois
Immigrants from South Eastern Asia
Child Poverty Under the Age of 16
Child Poverty Under the Age of 16 Comparison
Iroquois
Immigrants from South Eastern Asia
19.9%
CHILD POVERTY UNDER THE AGE OF 16
0.1/ 100
METRIC RATING
277th/ 347
METRIC RANK
15.2%
CHILD POVERTY UNDER THE AGE OF 16
89.0/ 100
METRIC RATING
133rd/ 347
METRIC RANK
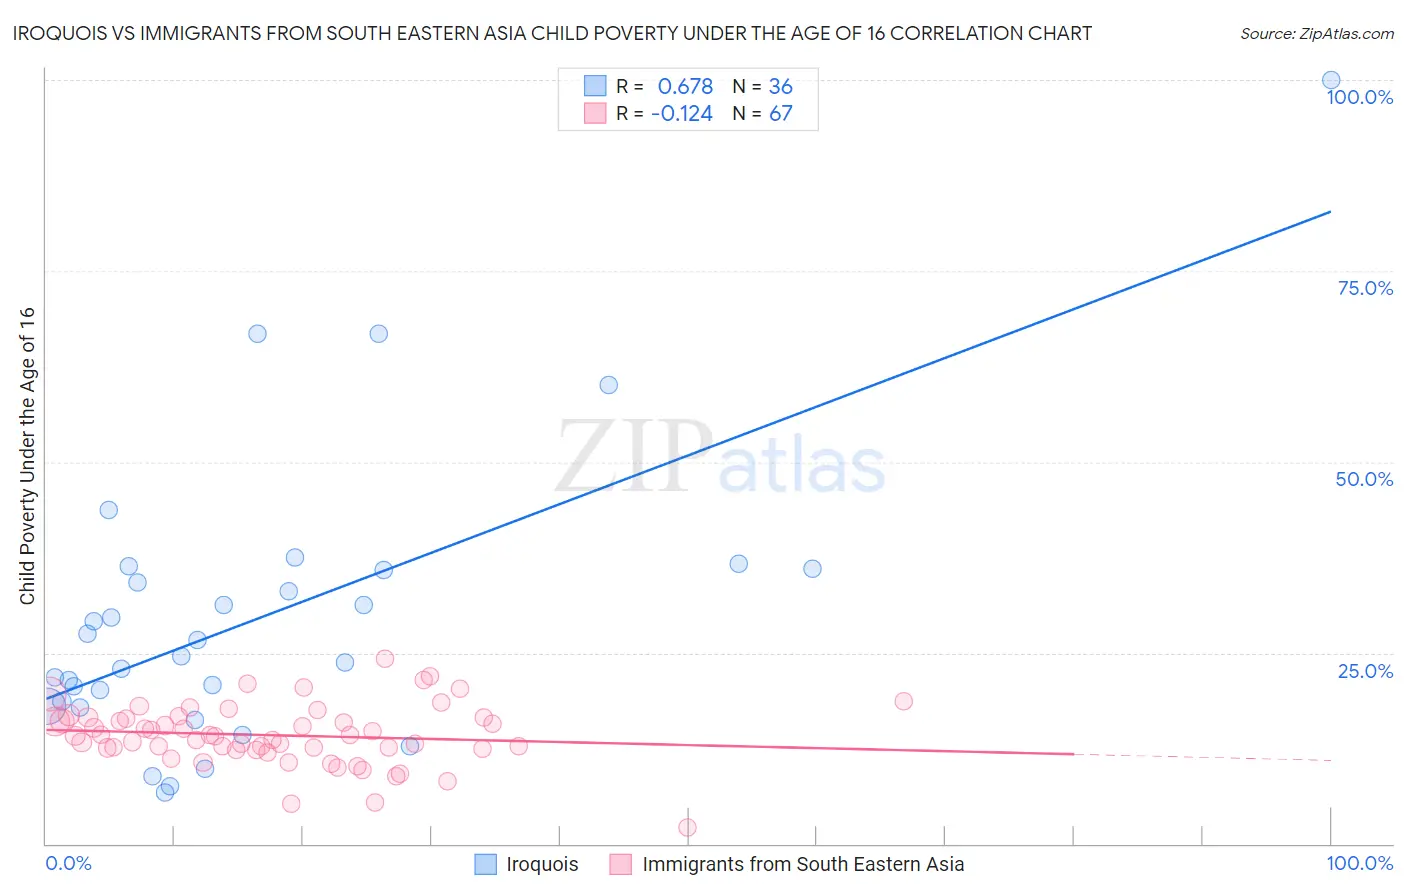
Iroquois vs Immigrants from South Eastern Asia Child Poverty Under the Age of 16 Correlation Chart
The statistical analysis conducted on geographies consisting of 206,484,755 people shows a significant positive correlation between the proportion of Iroquois and poverty level among children under the age of 16 in the United States with a correlation coefficient (R) of 0.678 and weighted average of 19.9%. Similarly, the statistical analysis conducted on geographies consisting of 505,405,353 people shows a poor negative correlation between the proportion of Immigrants from South Eastern Asia and poverty level among children under the age of 16 in the United States with a correlation coefficient (R) of -0.124 and weighted average of 15.2%, a difference of 30.9%.
Child Poverty Under the Age of 16 Correlation Summary
| Measurement | Iroquois | Immigrants from South Eastern Asia |
| Minimum | 6.7% | 2.1% |
| Maximum | 100.0% | 24.2% |
| Range | 93.3% | 22.1% |
| Mean | 29.7% | 14.2% |
| Median | 25.6% | 14.1% |
| Interquartile 25% (IQ1) | 18.3% | 12.4% |
| Interquartile 75% (IQ3) | 36.0% | 16.5% |
| Interquartile Range (IQR) | 17.6% | 4.1% |
| Standard Deviation (Sample) | 18.9% | 4.0% |
| Standard Deviation (Population) | 18.7% | 3.9% |
Similar Demographics by Child Poverty Under the Age of 16
Demographics Similar to Iroquois by Child Poverty Under the Age of 16
In terms of child poverty under the age of 16, the demographic groups most similar to Iroquois are Bangladeshi (19.9%, a difference of 0.10%), Subsaharan African (19.9%, a difference of 0.10%), Comanche (19.9%, a difference of 0.11%), Immigrants from Barbados (19.9%, a difference of 0.14%), and Belizean (19.9%, a difference of 0.14%).
| Demographics | Rating | Rank | Child Poverty Under the Age of 16 |
| Spanish American Indians | 0.1 /100 | #270 | Tragic 19.7% |
| Immigrants | Liberia | 0.1 /100 | #271 | Tragic 19.7% |
| Immigrants | Bangladesh | 0.1 /100 | #272 | Tragic 19.8% |
| Immigrants | Jamaica | 0.1 /100 | #273 | Tragic 19.8% |
| Immigrants | Cabo Verde | 0.1 /100 | #274 | Tragic 19.9% |
| Immigrants | Barbados | 0.1 /100 | #275 | Tragic 19.9% |
| Belizeans | 0.1 /100 | #276 | Tragic 19.9% |
| Iroquois | 0.1 /100 | #277 | Tragic 19.9% |
| Bangladeshis | 0.0 /100 | #278 | Tragic 19.9% |
| Sub-Saharan Africans | 0.0 /100 | #279 | Tragic 19.9% |
| Comanche | 0.0 /100 | #280 | Tragic 19.9% |
| Central Americans | 0.0 /100 | #281 | Tragic 20.0% |
| Barbadians | 0.0 /100 | #282 | Tragic 20.0% |
| Immigrants | Zaire | 0.0 /100 | #283 | Tragic 20.1% |
| West Indians | 0.0 /100 | #284 | Tragic 20.1% |
Demographics Similar to Immigrants from South Eastern Asia by Child Poverty Under the Age of 16
In terms of child poverty under the age of 16, the demographic groups most similar to Immigrants from South Eastern Asia are Canadian (15.2%, a difference of 0.050%), Native Hawaiian (15.2%, a difference of 0.090%), Albanian (15.2%, a difference of 0.13%), Armenian (15.2%, a difference of 0.14%), and Mongolian (15.2%, a difference of 0.17%).
| Demographics | Rating | Rank | Child Poverty Under the Age of 16 |
| Portuguese | 90.6 /100 | #126 | Exceptional 15.1% |
| Immigrants | Western Europe | 90.3 /100 | #127 | Exceptional 15.1% |
| Immigrants | Kazakhstan | 90.2 /100 | #128 | Exceptional 15.1% |
| Immigrants | Southern Europe | 89.7 /100 | #129 | Excellent 15.1% |
| Mongolians | 89.5 /100 | #130 | Excellent 15.2% |
| Armenians | 89.4 /100 | #131 | Excellent 15.2% |
| Canadians | 89.1 /100 | #132 | Excellent 15.2% |
| Immigrants | South Eastern Asia | 89.0 /100 | #133 | Excellent 15.2% |
| Native Hawaiians | 88.7 /100 | #134 | Excellent 15.2% |
| Albanians | 88.6 /100 | #135 | Excellent 15.2% |
| Immigrants | Spain | 87.3 /100 | #136 | Excellent 15.3% |
| Peruvians | 87.2 /100 | #137 | Excellent 15.3% |
| Welsh | 87.2 /100 | #138 | Excellent 15.3% |
| Immigrants | Vietnam | 87.1 /100 | #139 | Excellent 15.3% |
| New Zealanders | 86.9 /100 | #140 | Excellent 15.3% |