Iroquois vs Ukrainian Child Poverty Under the Age of 16
COMPARE
Iroquois
Ukrainian
Child Poverty Under the Age of 16
Child Poverty Under the Age of 16 Comparison
Iroquois
Ukrainians
19.9%
CHILD POVERTY UNDER THE AGE OF 16
0.1/ 100
METRIC RATING
277th/ 347
METRIC RANK
14.4%
CHILD POVERTY UNDER THE AGE OF 16
97.5/ 100
METRIC RATING
75th/ 347
METRIC RANK
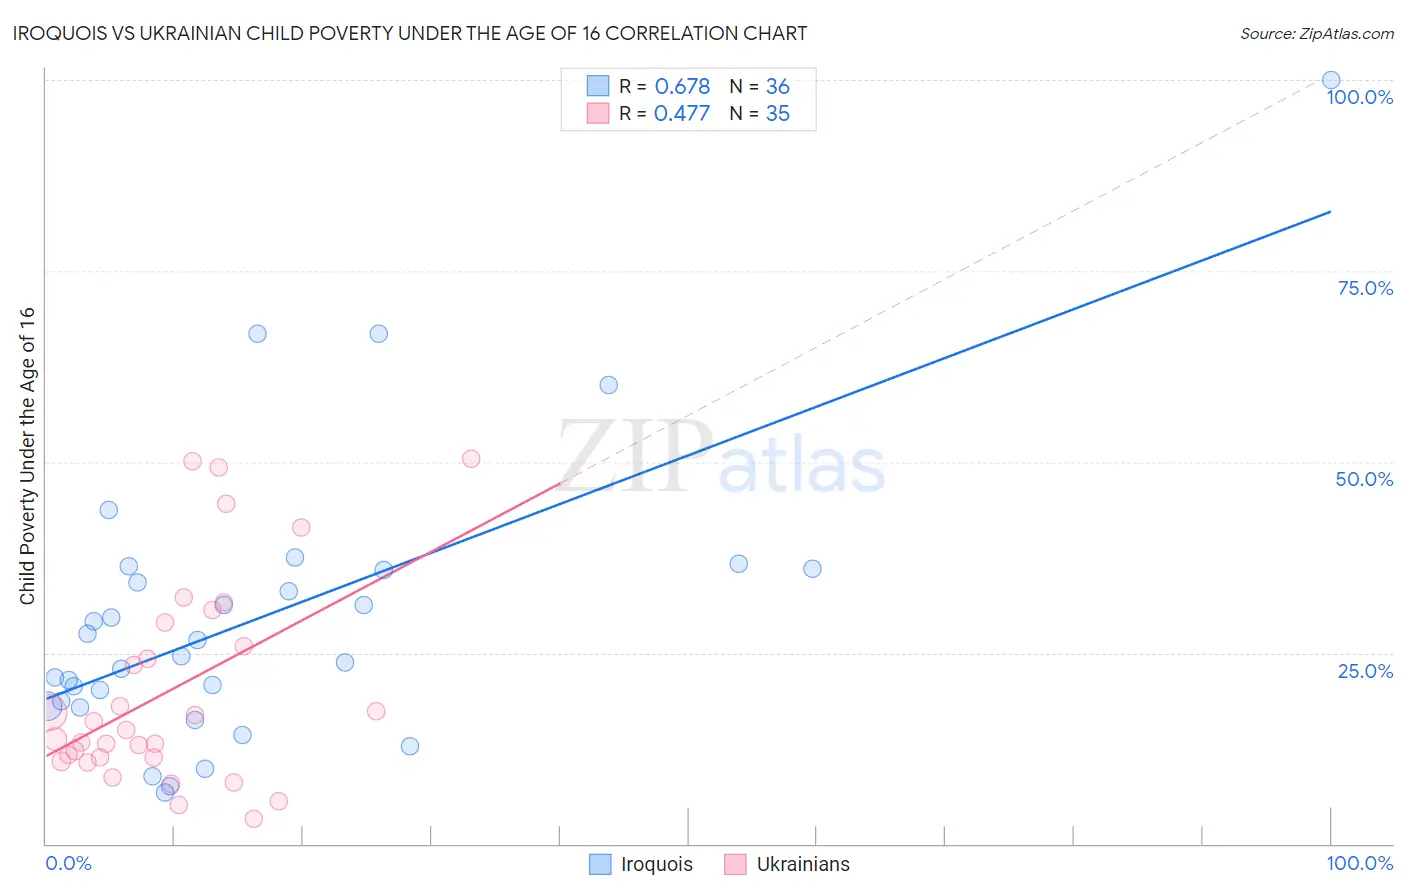
Iroquois vs Ukrainian Child Poverty Under the Age of 16 Correlation Chart
The statistical analysis conducted on geographies consisting of 206,484,755 people shows a significant positive correlation between the proportion of Iroquois and poverty level among children under the age of 16 in the United States with a correlation coefficient (R) of 0.678 and weighted average of 19.9%. Similarly, the statistical analysis conducted on geographies consisting of 441,775,506 people shows a moderate positive correlation between the proportion of Ukrainians and poverty level among children under the age of 16 in the United States with a correlation coefficient (R) of 0.477 and weighted average of 14.4%, a difference of 37.8%.
Child Poverty Under the Age of 16 Correlation Summary
| Measurement | Iroquois | Ukrainian |
| Minimum | 6.7% | 3.2% |
| Maximum | 100.0% | 50.5% |
| Range | 93.3% | 47.2% |
| Mean | 29.7% | 20.2% |
| Median | 25.6% | 14.9% |
| Interquartile 25% (IQ1) | 18.3% | 11.3% |
| Interquartile 75% (IQ3) | 36.0% | 29.0% |
| Interquartile Range (IQR) | 17.6% | 17.8% |
| Standard Deviation (Sample) | 18.9% | 13.5% |
| Standard Deviation (Population) | 18.7% | 13.3% |
Similar Demographics by Child Poverty Under the Age of 16
Demographics Similar to Iroquois by Child Poverty Under the Age of 16
In terms of child poverty under the age of 16, the demographic groups most similar to Iroquois are Bangladeshi (19.9%, a difference of 0.10%), Subsaharan African (19.9%, a difference of 0.10%), Comanche (19.9%, a difference of 0.11%), Immigrants from Barbados (19.9%, a difference of 0.14%), and Belizean (19.9%, a difference of 0.14%).
| Demographics | Rating | Rank | Child Poverty Under the Age of 16 |
| Spanish American Indians | 0.1 /100 | #270 | Tragic 19.7% |
| Immigrants | Liberia | 0.1 /100 | #271 | Tragic 19.7% |
| Immigrants | Bangladesh | 0.1 /100 | #272 | Tragic 19.8% |
| Immigrants | Jamaica | 0.1 /100 | #273 | Tragic 19.8% |
| Immigrants | Cabo Verde | 0.1 /100 | #274 | Tragic 19.9% |
| Immigrants | Barbados | 0.1 /100 | #275 | Tragic 19.9% |
| Belizeans | 0.1 /100 | #276 | Tragic 19.9% |
| Iroquois | 0.1 /100 | #277 | Tragic 19.9% |
| Bangladeshis | 0.0 /100 | #278 | Tragic 19.9% |
| Sub-Saharan Africans | 0.0 /100 | #279 | Tragic 19.9% |
| Comanche | 0.0 /100 | #280 | Tragic 19.9% |
| Central Americans | 0.0 /100 | #281 | Tragic 20.0% |
| Barbadians | 0.0 /100 | #282 | Tragic 20.0% |
| Immigrants | Zaire | 0.0 /100 | #283 | Tragic 20.1% |
| West Indians | 0.0 /100 | #284 | Tragic 20.1% |
Demographics Similar to Ukrainians by Child Poverty Under the Age of 16
In terms of child poverty under the age of 16, the demographic groups most similar to Ukrainians are Immigrants from Eastern Europe (14.4%, a difference of 0.0%), Australian (14.4%, a difference of 0.040%), Macedonian (14.4%, a difference of 0.20%), Immigrants from Turkey (14.4%, a difference of 0.21%), and Immigrants from Russia (14.5%, a difference of 0.23%).
| Demographics | Rating | Rank | Child Poverty Under the Age of 16 |
| Laotians | 98.0 /100 | #68 | Exceptional 14.3% |
| Immigrants | Bulgaria | 98.0 /100 | #69 | Exceptional 14.3% |
| Immigrants | Netherlands | 97.9 /100 | #70 | Exceptional 14.3% |
| Immigrants | Poland | 97.9 /100 | #71 | Exceptional 14.3% |
| Cambodians | 97.8 /100 | #72 | Exceptional 14.4% |
| Immigrants | Turkey | 97.6 /100 | #73 | Exceptional 14.4% |
| Macedonians | 97.6 /100 | #74 | Exceptional 14.4% |
| Ukrainians | 97.5 /100 | #75 | Exceptional 14.4% |
| Immigrants | Eastern Europe | 97.5 /100 | #76 | Exceptional 14.4% |
| Australians | 97.5 /100 | #77 | Exceptional 14.4% |
| Immigrants | Russia | 97.3 /100 | #78 | Exceptional 14.5% |
| Swiss | 97.3 /100 | #79 | Exceptional 14.5% |
| Immigrants | North Macedonia | 97.2 /100 | #80 | Exceptional 14.5% |
| Finns | 97.2 /100 | #81 | Exceptional 14.5% |
| Immigrants | Canada | 97.2 /100 | #82 | Exceptional 14.5% |