Iranian vs Immigrants from South Eastern Asia Child Poverty Under the Age of 16
COMPARE
Iranian
Immigrants from South Eastern Asia
Child Poverty Under the Age of 16
Child Poverty Under the Age of 16 Comparison
Iranians
Immigrants from South Eastern Asia
12.2%
CHILD POVERTY UNDER THE AGE OF 16
100.0/ 100
METRIC RATING
7th/ 347
METRIC RANK
15.2%
CHILD POVERTY UNDER THE AGE OF 16
89.0/ 100
METRIC RATING
133rd/ 347
METRIC RANK
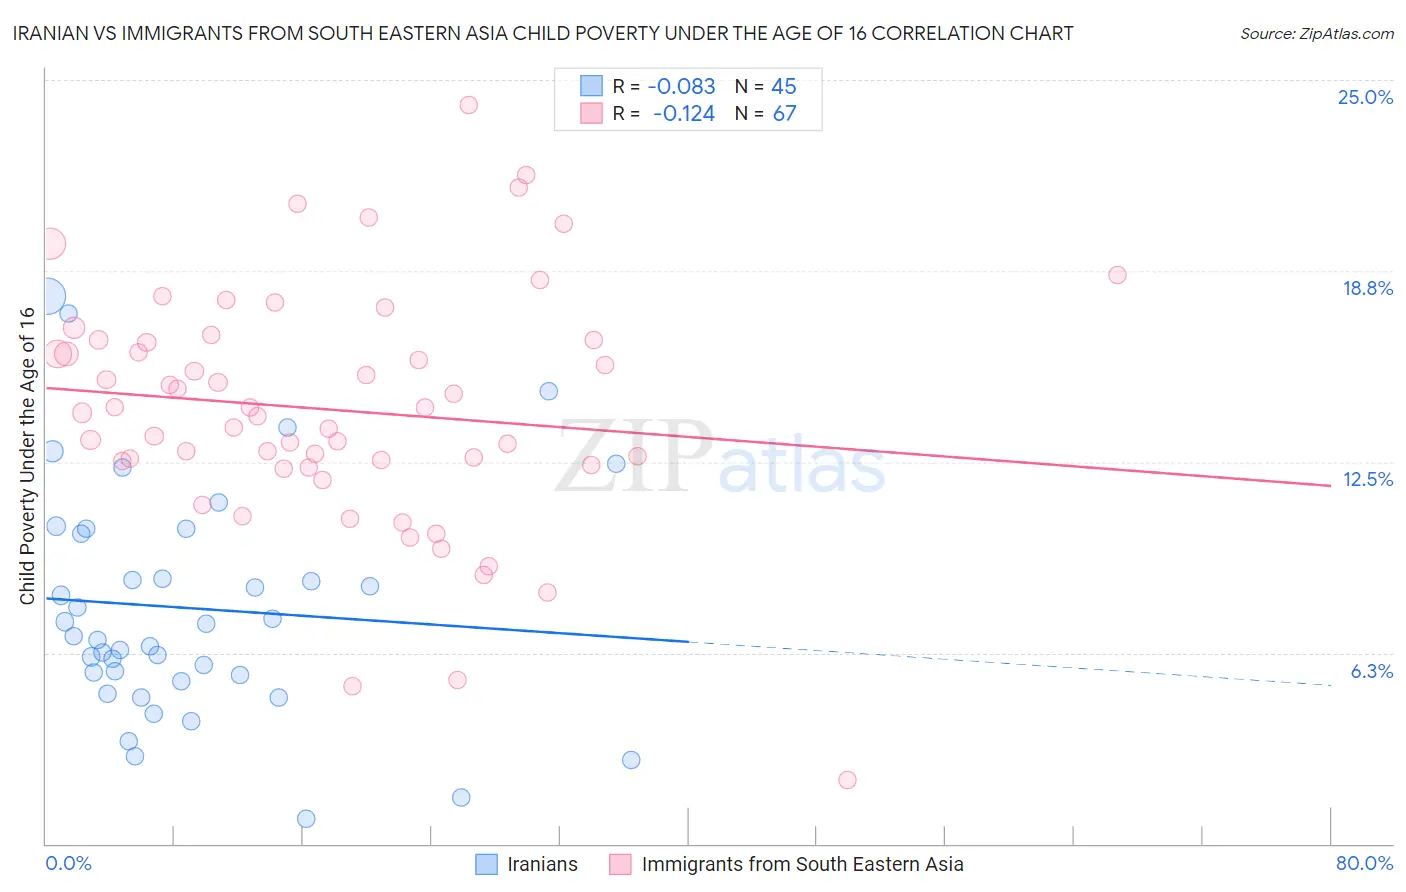
Iranian vs Immigrants from South Eastern Asia Child Poverty Under the Age of 16 Correlation Chart
The statistical analysis conducted on geographies consisting of 314,255,547 people shows a slight negative correlation between the proportion of Iranians and poverty level among children under the age of 16 in the United States with a correlation coefficient (R) of -0.083 and weighted average of 12.2%. Similarly, the statistical analysis conducted on geographies consisting of 505,405,353 people shows a poor negative correlation between the proportion of Immigrants from South Eastern Asia and poverty level among children under the age of 16 in the United States with a correlation coefficient (R) of -0.124 and weighted average of 15.2%, a difference of 24.2%.
Child Poverty Under the Age of 16 Correlation Summary
| Measurement | Iranian | Immigrants from South Eastern Asia |
| Minimum | 0.81% | 2.1% |
| Maximum | 17.9% | 24.2% |
| Range | 17.1% | 22.1% |
| Mean | 7.7% | 14.2% |
| Median | 6.8% | 14.1% |
| Interquartile 25% (IQ1) | 5.4% | 12.4% |
| Interquartile 75% (IQ3) | 10.2% | 16.5% |
| Interquartile Range (IQR) | 4.8% | 4.1% |
| Standard Deviation (Sample) | 3.8% | 4.0% |
| Standard Deviation (Population) | 3.8% | 3.9% |
Similar Demographics by Child Poverty Under the Age of 16
Demographics Similar to Iranians by Child Poverty Under the Age of 16
In terms of child poverty under the age of 16, the demographic groups most similar to Iranians are Immigrants from Hong Kong (12.1%, a difference of 0.76%), Immigrants from Singapore (12.4%, a difference of 1.1%), Immigrants from Iran (12.4%, a difference of 1.2%), Immigrants from South Central Asia (12.5%, a difference of 2.4%), and Bhutanese (12.5%, a difference of 2.4%).
| Demographics | Rating | Rank | Child Poverty Under the Age of 16 |
| Immigrants | India | 100.0 /100 | #1 | Exceptional 10.8% |
| Immigrants | Taiwan | 100.0 /100 | #2 | Exceptional 11.0% |
| Filipinos | 100.0 /100 | #3 | Exceptional 11.1% |
| Thais | 100.0 /100 | #4 | Exceptional 11.6% |
| Chinese | 100.0 /100 | #5 | Exceptional 11.9% |
| Immigrants | Hong Kong | 100.0 /100 | #6 | Exceptional 12.1% |
| Iranians | 100.0 /100 | #7 | Exceptional 12.2% |
| Immigrants | Singapore | 100.0 /100 | #8 | Exceptional 12.4% |
| Immigrants | Iran | 100.0 /100 | #9 | Exceptional 12.4% |
| Immigrants | South Central Asia | 99.9 /100 | #10 | Exceptional 12.5% |
| Bhutanese | 99.9 /100 | #11 | Exceptional 12.5% |
| Immigrants | Ireland | 99.9 /100 | #12 | Exceptional 12.7% |
| Burmese | 99.9 /100 | #13 | Exceptional 12.8% |
| Immigrants | Lithuania | 99.9 /100 | #14 | Exceptional 12.9% |
| Immigrants | Korea | 99.9 /100 | #15 | Exceptional 13.0% |
Demographics Similar to Immigrants from South Eastern Asia by Child Poverty Under the Age of 16
In terms of child poverty under the age of 16, the demographic groups most similar to Immigrants from South Eastern Asia are Canadian (15.2%, a difference of 0.050%), Native Hawaiian (15.2%, a difference of 0.090%), Albanian (15.2%, a difference of 0.13%), Armenian (15.2%, a difference of 0.14%), and Mongolian (15.2%, a difference of 0.17%).
| Demographics | Rating | Rank | Child Poverty Under the Age of 16 |
| Portuguese | 90.6 /100 | #126 | Exceptional 15.1% |
| Immigrants | Western Europe | 90.3 /100 | #127 | Exceptional 15.1% |
| Immigrants | Kazakhstan | 90.2 /100 | #128 | Exceptional 15.1% |
| Immigrants | Southern Europe | 89.7 /100 | #129 | Excellent 15.1% |
| Mongolians | 89.5 /100 | #130 | Excellent 15.2% |
| Armenians | 89.4 /100 | #131 | Excellent 15.2% |
| Canadians | 89.1 /100 | #132 | Excellent 15.2% |
| Immigrants | South Eastern Asia | 89.0 /100 | #133 | Excellent 15.2% |
| Native Hawaiians | 88.7 /100 | #134 | Excellent 15.2% |
| Albanians | 88.6 /100 | #135 | Excellent 15.2% |
| Immigrants | Spain | 87.3 /100 | #136 | Excellent 15.3% |
| Peruvians | 87.2 /100 | #137 | Excellent 15.3% |
| Welsh | 87.2 /100 | #138 | Excellent 15.3% |
| Immigrants | Vietnam | 87.1 /100 | #139 | Excellent 15.3% |
| New Zealanders | 86.9 /100 | #140 | Excellent 15.3% |