Irish vs British 3rd Grade
COMPARE
Irish
British
3rd Grade
3rd Grade Comparison
Irish
British
98.5%
3RD GRADE
100.0/ 100
METRIC RATING
18th/ 347
METRIC RANK
98.4%
3RD GRADE
99.9/ 100
METRIC RATING
36th/ 347
METRIC RANK
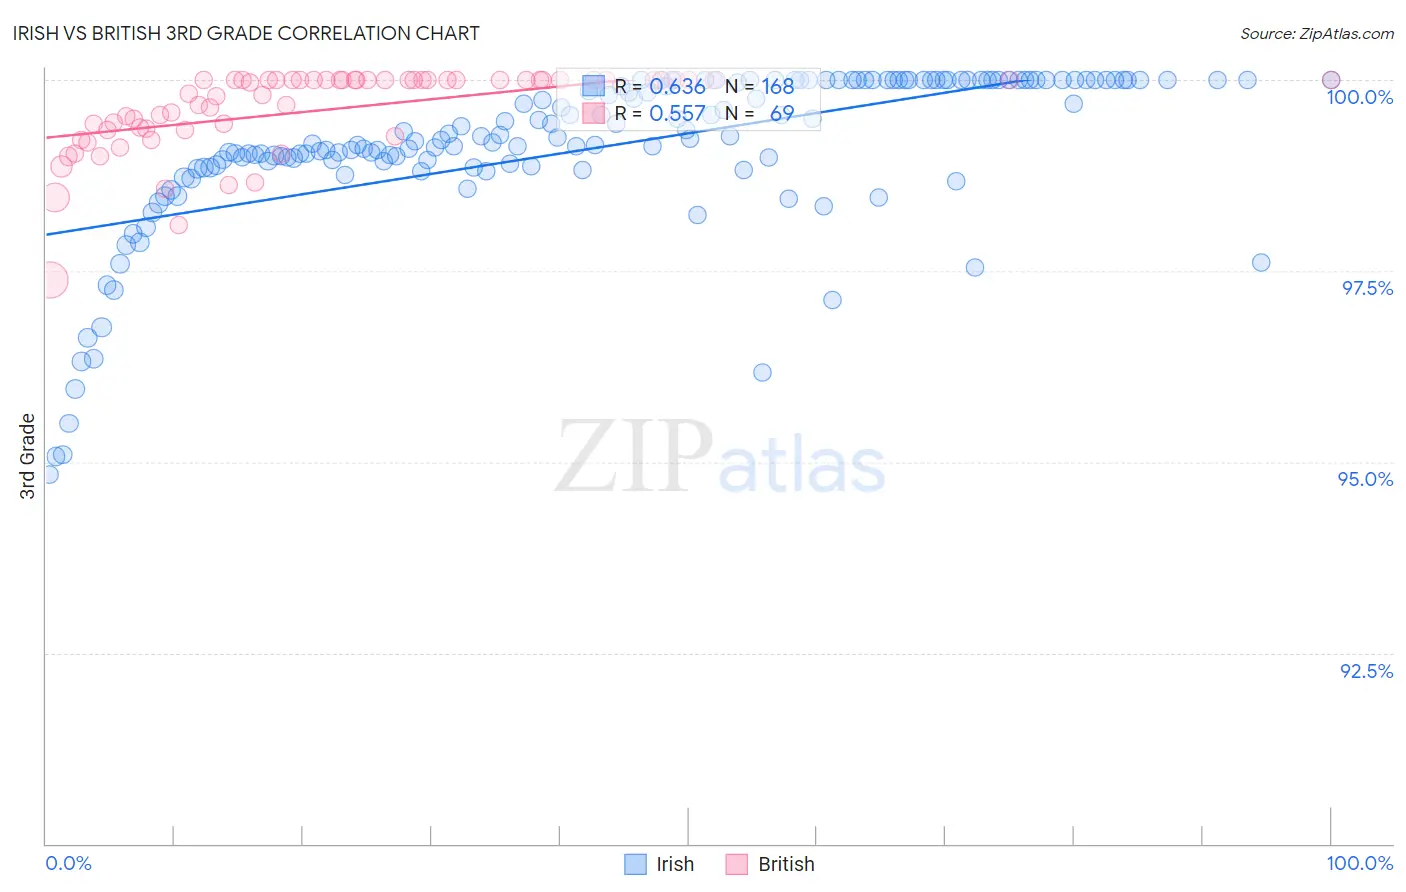
Irish vs British 3rd Grade Correlation Chart
The statistical analysis conducted on geographies consisting of 580,708,963 people shows a significant positive correlation between the proportion of Irish and percentage of population with at least 3rd grade education in the United States with a correlation coefficient (R) of 0.636 and weighted average of 98.5%. Similarly, the statistical analysis conducted on geographies consisting of 531,462,526 people shows a substantial positive correlation between the proportion of British and percentage of population with at least 3rd grade education in the United States with a correlation coefficient (R) of 0.557 and weighted average of 98.4%, a difference of 0.11%.
3rd Grade Correlation Summary
| Measurement | Irish | British |
| Minimum | 94.8% | 97.4% |
| Maximum | 100.0% | 100.0% |
| Range | 5.2% | 2.6% |
| Mean | 99.1% | 99.6% |
| Median | 99.2% | 100.0% |
| Interquartile 25% (IQ1) | 98.9% | 99.3% |
| Interquartile 75% (IQ3) | 100.0% | 100.0% |
| Interquartile Range (IQR) | 1.1% | 0.65% |
| Standard Deviation (Sample) | 1.1% | 0.55% |
| Standard Deviation (Population) | 1.1% | 0.54% |
Demographics Similar to Irish and British by 3rd Grade
In terms of 3rd grade, the demographic groups most similar to Irish are Dutch (98.5%, a difference of 0.010%), Polish (98.5%, a difference of 0.010%), Pennsylvania German (98.5%, a difference of 0.010%), Lithuanian (98.5%, a difference of 0.010%), and Finnish (98.5%, a difference of 0.020%). Similarly, the demographic groups most similar to British are Arapaho (98.4%, a difference of 0.010%), Italian (98.4%, a difference of 0.010%), Chinese (98.4%, a difference of 0.020%), Swiss (98.4%, a difference of 0.020%), and European (98.4%, a difference of 0.050%).
| Demographics | Rating | Rank | 3rd Grade |
| Dutch | 100.0 /100 | #17 | Exceptional 98.5% |
| Irish | 100.0 /100 | #18 | Exceptional 98.5% |
| Poles | 100.0 /100 | #19 | Exceptional 98.5% |
| Pennsylvania Germans | 100.0 /100 | #20 | Exceptional 98.5% |
| Lithuanians | 100.0 /100 | #21 | Exceptional 98.5% |
| Finns | 100.0 /100 | #22 | Exceptional 98.5% |
| Sioux | 100.0 /100 | #23 | Exceptional 98.5% |
| Danes | 100.0 /100 | #24 | Exceptional 98.5% |
| Scotch-Irish | 100.0 /100 | #25 | Exceptional 98.5% |
| Aleuts | 100.0 /100 | #26 | Exceptional 98.5% |
| Croatians | 100.0 /100 | #27 | Exceptional 98.5% |
| French | 100.0 /100 | #28 | Exceptional 98.4% |
| French Canadians | 100.0 /100 | #29 | Exceptional 98.4% |
| Europeans | 100.0 /100 | #30 | Exceptional 98.4% |
| Czechs | 100.0 /100 | #31 | Exceptional 98.4% |
| Scandinavians | 100.0 /100 | #32 | Exceptional 98.4% |
| Chinese | 100.0 /100 | #33 | Exceptional 98.4% |
| Swiss | 100.0 /100 | #34 | Exceptional 98.4% |
| Arapaho | 100.0 /100 | #35 | Exceptional 98.4% |
| British | 99.9 /100 | #36 | Exceptional 98.4% |
| Italians | 99.9 /100 | #37 | Exceptional 98.4% |