Iranian vs Immigrants from Colombia Female Poverty Among 25-34 Year Olds
COMPARE
Iranian
Immigrants from Colombia
Female Poverty Among 25-34 Year Olds
Female Poverty Among 25-34 Year Olds Comparison
Iranians
Immigrants from Colombia
11.2%
FEMALE POVERTY AMONG 25-34 YEAR OLDS
100.0/ 100
METRIC RATING
19th/ 347
METRIC RANK
13.3%
FEMALE POVERTY AMONG 25-34 YEAR OLDS
69.2/ 100
METRIC RATING
158th/ 347
METRIC RANK
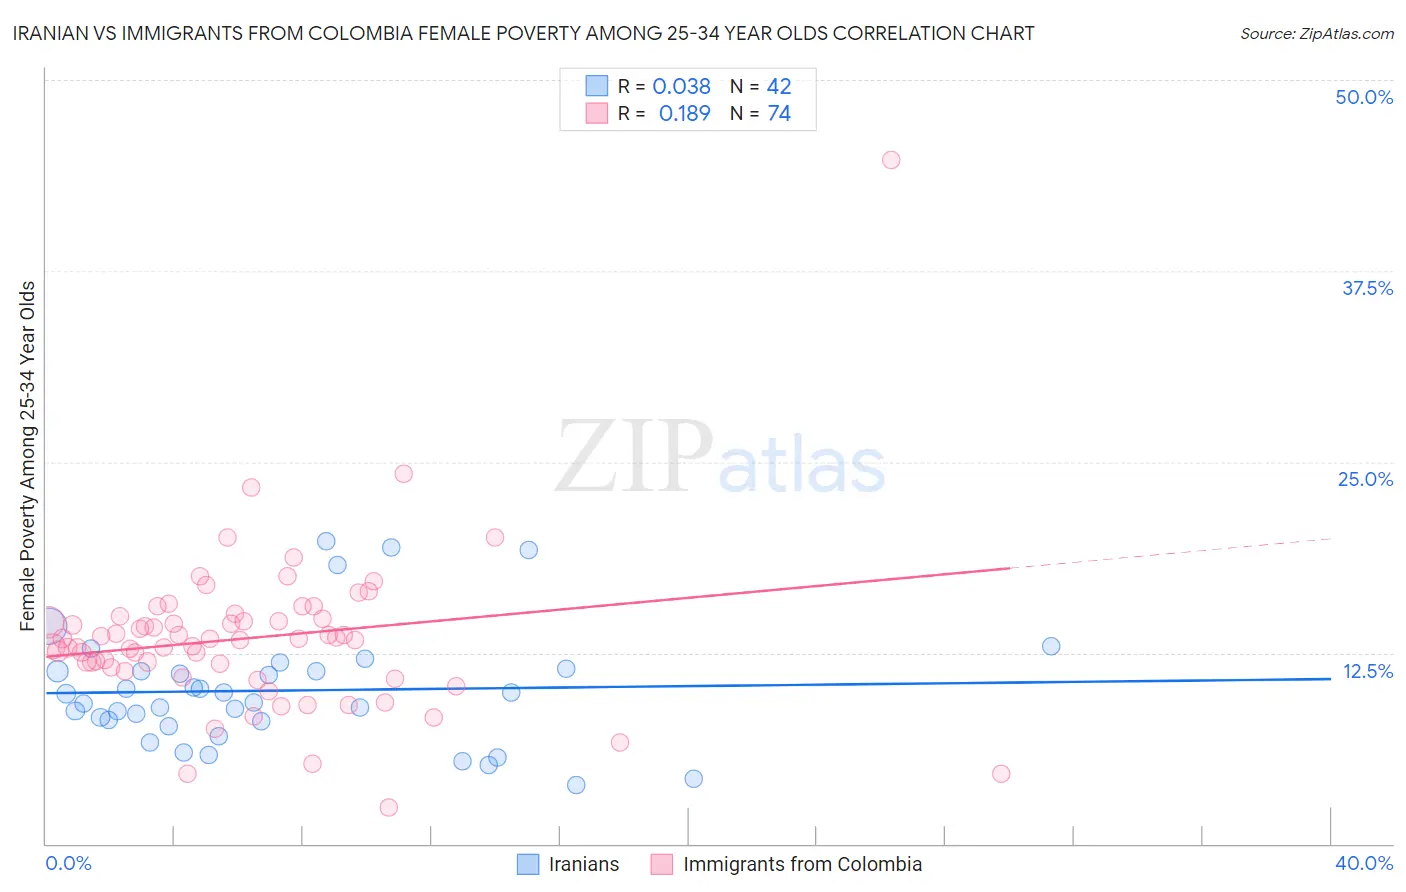
Iranian vs Immigrants from Colombia Female Poverty Among 25-34 Year Olds Correlation Chart
The statistical analysis conducted on geographies consisting of 312,428,858 people shows no correlation between the proportion of Iranians and poverty level among females between the ages 25 and 34 in the United States with a correlation coefficient (R) of 0.038 and weighted average of 11.2%. Similarly, the statistical analysis conducted on geographies consisting of 373,334,507 people shows a poor positive correlation between the proportion of Immigrants from Colombia and poverty level among females between the ages 25 and 34 in the United States with a correlation coefficient (R) of 0.189 and weighted average of 13.3%, a difference of 18.5%.
Female Poverty Among 25-34 Year Olds Correlation Summary
| Measurement | Iranian | Immigrants from Colombia |
| Minimum | 3.8% | 2.4% |
| Maximum | 19.8% | 44.7% |
| Range | 16.0% | 42.4% |
| Mean | 10.0% | 13.5% |
| Median | 9.5% | 13.4% |
| Interquartile 25% (IQ1) | 8.0% | 11.5% |
| Interquartile 75% (IQ3) | 11.3% | 14.8% |
| Interquartile Range (IQR) | 3.4% | 3.2% |
| Standard Deviation (Sample) | 3.8% | 5.3% |
| Standard Deviation (Population) | 3.8% | 5.3% |
Similar Demographics by Female Poverty Among 25-34 Year Olds
Demographics Similar to Iranians by Female Poverty Among 25-34 Year Olds
In terms of female poverty among 25-34 year olds, the demographic groups most similar to Iranians are Immigrants from Eastern Asia (11.2%, a difference of 0.14%), Immigrants from China (11.2%, a difference of 0.25%), Immigrants from Bolivia (11.2%, a difference of 0.32%), Assyrian/Chaldean/Syriac (11.2%, a difference of 0.36%), and Burmese (11.2%, a difference of 0.47%).
| Demographics | Rating | Rank | Female Poverty Among 25-34 Year Olds |
| Immigrants | Ireland | 100.0 /100 | #12 | Exceptional 11.2% |
| Burmese | 100.0 /100 | #13 | Exceptional 11.2% |
| Indians (Asian) | 100.0 /100 | #14 | Exceptional 11.2% |
| Assyrians/Chaldeans/Syriacs | 100.0 /100 | #15 | Exceptional 11.2% |
| Immigrants | Bolivia | 100.0 /100 | #16 | Exceptional 11.2% |
| Immigrants | China | 100.0 /100 | #17 | Exceptional 11.2% |
| Immigrants | Eastern Asia | 100.0 /100 | #18 | Exceptional 11.2% |
| Iranians | 100.0 /100 | #19 | Exceptional 11.2% |
| Okinawans | 100.0 /100 | #20 | Exceptional 11.3% |
| Turks | 100.0 /100 | #21 | Exceptional 11.4% |
| Asians | 99.9 /100 | #22 | Exceptional 11.4% |
| Bolivians | 99.9 /100 | #23 | Exceptional 11.4% |
| Maltese | 99.9 /100 | #24 | Exceptional 11.4% |
| Bhutanese | 99.9 /100 | #25 | Exceptional 11.4% |
| Tongans | 99.9 /100 | #26 | Exceptional 11.5% |
Demographics Similar to Immigrants from Colombia by Female Poverty Among 25-34 Year Olds
In terms of female poverty among 25-34 year olds, the demographic groups most similar to Immigrants from Colombia are Immigrants from Western Europe (13.3%, a difference of 0.11%), Uruguayan (13.3%, a difference of 0.22%), Immigrants from Cameroon (13.3%, a difference of 0.28%), Immigrants from South America (13.3%, a difference of 0.28%), and Icelander (13.3%, a difference of 0.34%).
| Demographics | Rating | Rank | Female Poverty Among 25-34 Year Olds |
| Costa Ricans | 75.8 /100 | #151 | Good 13.2% |
| Slavs | 75.7 /100 | #152 | Good 13.2% |
| Northern Europeans | 73.7 /100 | #153 | Good 13.2% |
| Arabs | 73.5 /100 | #154 | Good 13.2% |
| Immigrants | Sierra Leone | 72.9 /100 | #155 | Good 13.3% |
| Immigrants | Cameroon | 72.0 /100 | #156 | Good 13.3% |
| Immigrants | Western Europe | 70.3 /100 | #157 | Good 13.3% |
| Immigrants | Colombia | 69.2 /100 | #158 | Good 13.3% |
| Uruguayans | 66.9 /100 | #159 | Good 13.3% |
| Immigrants | South America | 66.3 /100 | #160 | Good 13.3% |
| Icelanders | 65.7 /100 | #161 | Good 13.3% |
| Ugandans | 64.1 /100 | #162 | Good 13.4% |
| British | 63.5 /100 | #163 | Good 13.4% |
| Swiss | 61.7 /100 | #164 | Good 13.4% |
| Basques | 59.3 /100 | #165 | Average 13.4% |