Inupiat vs Northern European Female Poverty Among 18-24 Year Olds
COMPARE
Inupiat
Northern European
Female Poverty Among 18-24 Year Olds
Female Poverty Among 18-24 Year Olds Comparison
Inupiat
Northern Europeans
22.6%
FEMALE POVERTY AMONG 18-24 YEAR OLDS
0.0/ 100
METRIC RATING
297th/ 347
METRIC RANK
20.6%
FEMALE POVERTY AMONG 18-24 YEAR OLDS
11.6/ 100
METRIC RATING
213th/ 347
METRIC RANK
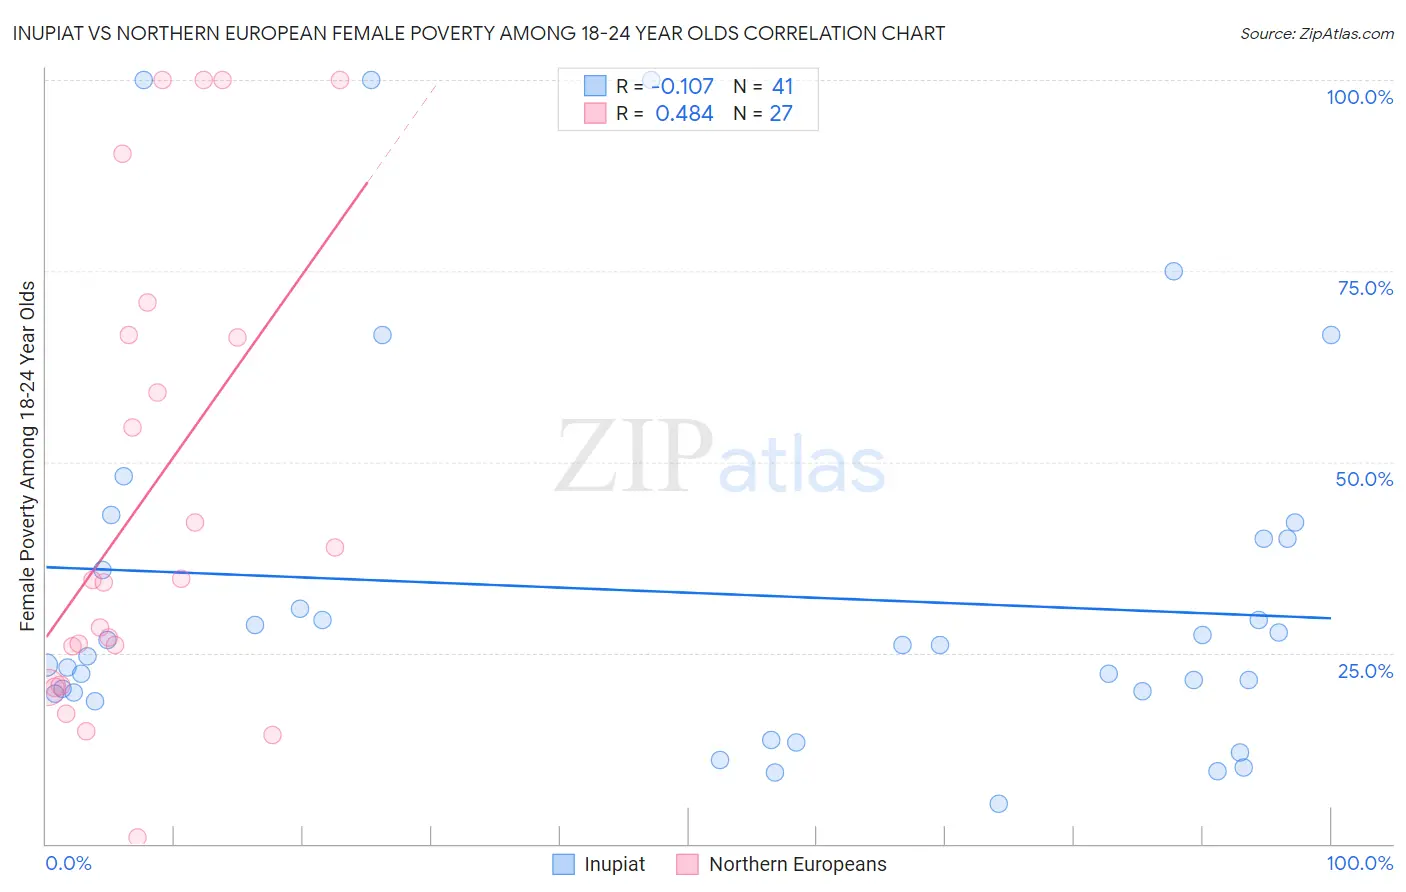
Inupiat vs Northern European Female Poverty Among 18-24 Year Olds Correlation Chart
The statistical analysis conducted on geographies consisting of 95,768,786 people shows a poor negative correlation between the proportion of Inupiat and poverty level among females between the ages 18 and 24 in the United States with a correlation coefficient (R) of -0.107 and weighted average of 22.6%. Similarly, the statistical analysis conducted on geographies consisting of 393,501,500 people shows a moderate positive correlation between the proportion of Northern Europeans and poverty level among females between the ages 18 and 24 in the United States with a correlation coefficient (R) of 0.484 and weighted average of 20.6%, a difference of 9.6%.
Female Poverty Among 18-24 Year Olds Correlation Summary
| Measurement | Inupiat | Northern European |
| Minimum | 5.2% | 0.88% |
| Maximum | 100.0% | 100.0% |
| Range | 94.8% | 99.1% |
| Mean | 32.9% | 45.7% |
| Median | 26.0% | 34.6% |
| Interquartile 25% (IQ1) | 19.7% | 20.7% |
| Interquartile 75% (IQ3) | 40.0% | 66.7% |
| Interquartile Range (IQR) | 20.3% | 45.9% |
| Standard Deviation (Sample) | 24.5% | 30.7% |
| Standard Deviation (Population) | 24.2% | 30.1% |
Similar Demographics by Female Poverty Among 18-24 Year Olds
Demographics Similar to Inupiat by Female Poverty Among 18-24 Year Olds
In terms of female poverty among 18-24 year olds, the demographic groups most similar to Inupiat are Central American Indian (22.6%, a difference of 0.070%), Menominee (22.5%, a difference of 0.14%), Shoshone (22.5%, a difference of 0.25%), Indonesian (22.5%, a difference of 0.37%), and U.S. Virgin Islander (22.5%, a difference of 0.41%).
| Demographics | Rating | Rank | Female Poverty Among 18-24 Year Olds |
| Immigrants | Senegal | 0.0 /100 | #290 | Tragic 22.4% |
| Bangladeshis | 0.0 /100 | #291 | Tragic 22.5% |
| Alaskan Athabascans | 0.0 /100 | #292 | Tragic 22.5% |
| U.S. Virgin Islanders | 0.0 /100 | #293 | Tragic 22.5% |
| Indonesians | 0.0 /100 | #294 | Tragic 22.5% |
| Shoshone | 0.0 /100 | #295 | Tragic 22.5% |
| Menominee | 0.0 /100 | #296 | Tragic 22.5% |
| Inupiat | 0.0 /100 | #297 | Tragic 22.6% |
| Central American Indians | 0.0 /100 | #298 | Tragic 22.6% |
| Cherokee | 0.0 /100 | #299 | Tragic 22.7% |
| Africans | 0.0 /100 | #300 | Tragic 22.8% |
| Seminole | 0.0 /100 | #301 | Tragic 22.9% |
| Iroquois | 0.0 /100 | #302 | Tragic 22.9% |
| Senegalese | 0.0 /100 | #303 | Tragic 23.0% |
| Sudanese | 0.0 /100 | #304 | Tragic 23.0% |
Demographics Similar to Northern Europeans by Female Poverty Among 18-24 Year Olds
In terms of female poverty among 18-24 year olds, the demographic groups most similar to Northern Europeans are Liberian (20.6%, a difference of 0.010%), Immigrants from South Africa (20.6%, a difference of 0.11%), Spanish (20.6%, a difference of 0.15%), Immigrants from Western Africa (20.6%, a difference of 0.17%), and Immigrants from Western Europe (20.6%, a difference of 0.21%).
| Demographics | Rating | Rank | Female Poverty Among 18-24 Year Olds |
| Hispanics or Latinos | 16.6 /100 | #206 | Poor 20.5% |
| Spaniards | 16.3 /100 | #207 | Poor 20.5% |
| Dutch | 15.9 /100 | #208 | Poor 20.5% |
| Arabs | 15.5 /100 | #209 | Poor 20.5% |
| Immigrants | Ghana | 14.3 /100 | #210 | Poor 20.5% |
| Immigrants | Western Europe | 13.5 /100 | #211 | Poor 20.6% |
| Liberians | 11.6 /100 | #212 | Poor 20.6% |
| Northern Europeans | 11.6 /100 | #213 | Poor 20.6% |
| Immigrants | South Africa | 10.7 /100 | #214 | Poor 20.6% |
| Spanish | 10.4 /100 | #215 | Poor 20.6% |
| Immigrants | Western Africa | 10.2 /100 | #216 | Poor 20.6% |
| Immigrants | Laos | 9.7 /100 | #217 | Tragic 20.6% |
| Immigrants | Nepal | 9.6 /100 | #218 | Tragic 20.7% |
| Immigrants | Micronesia | 9.6 /100 | #219 | Tragic 20.7% |
| British | 9.4 /100 | #220 | Tragic 20.7% |