Inupiat vs Immigrants from Israel Female Poverty Among 18-24 Year Olds
COMPARE
Inupiat
Immigrants from Israel
Female Poverty Among 18-24 Year Olds
Female Poverty Among 18-24 Year Olds Comparison
Inupiat
Immigrants from Israel
22.6%
FEMALE POVERTY AMONG 18-24 YEAR OLDS
0.0/ 100
METRIC RATING
297th/ 347
METRIC RANK
20.4%
FEMALE POVERTY AMONG 18-24 YEAR OLDS
24.4/ 100
METRIC RATING
192nd/ 347
METRIC RANK
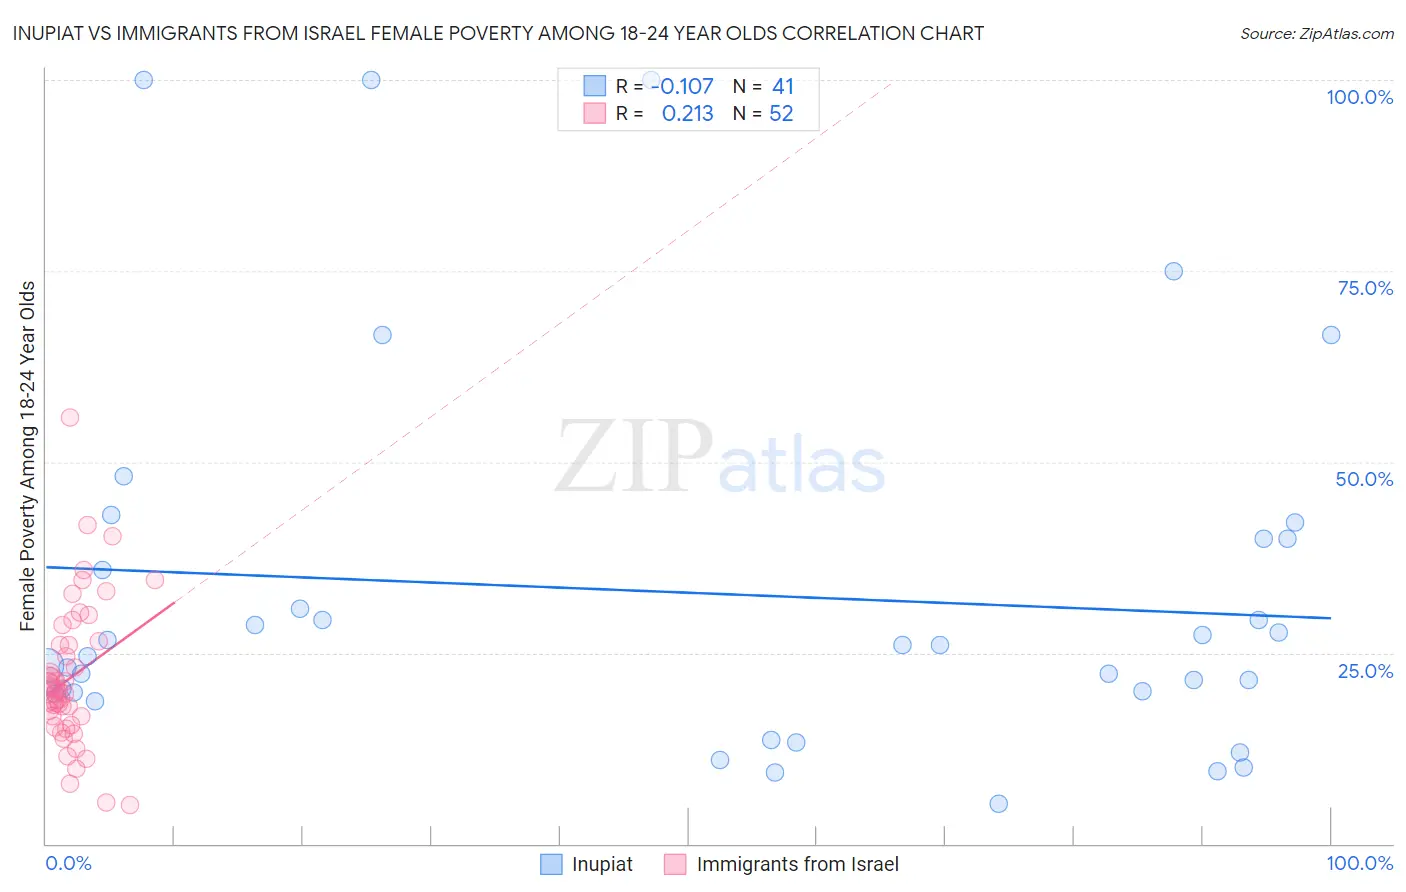
Inupiat vs Immigrants from Israel Female Poverty Among 18-24 Year Olds Correlation Chart
The statistical analysis conducted on geographies consisting of 95,768,786 people shows a poor negative correlation between the proportion of Inupiat and poverty level among females between the ages 18 and 24 in the United States with a correlation coefficient (R) of -0.107 and weighted average of 22.6%. Similarly, the statistical analysis conducted on geographies consisting of 206,741,395 people shows a weak positive correlation between the proportion of Immigrants from Israel and poverty level among females between the ages 18 and 24 in the United States with a correlation coefficient (R) of 0.213 and weighted average of 20.4%, a difference of 10.7%.
Female Poverty Among 18-24 Year Olds Correlation Summary
| Measurement | Inupiat | Immigrants from Israel |
| Minimum | 5.2% | 5.1% |
| Maximum | 100.0% | 55.8% |
| Range | 94.8% | 50.8% |
| Mean | 32.9% | 21.8% |
| Median | 26.0% | 20.2% |
| Interquartile 25% (IQ1) | 19.7% | 16.1% |
| Interquartile 75% (IQ3) | 40.0% | 26.3% |
| Interquartile Range (IQR) | 20.3% | 10.2% |
| Standard Deviation (Sample) | 24.5% | 9.5% |
| Standard Deviation (Population) | 24.2% | 9.4% |
Similar Demographics by Female Poverty Among 18-24 Year Olds
Demographics Similar to Inupiat by Female Poverty Among 18-24 Year Olds
In terms of female poverty among 18-24 year olds, the demographic groups most similar to Inupiat are Central American Indian (22.6%, a difference of 0.070%), Menominee (22.5%, a difference of 0.14%), Shoshone (22.5%, a difference of 0.25%), Indonesian (22.5%, a difference of 0.37%), and U.S. Virgin Islander (22.5%, a difference of 0.41%).
| Demographics | Rating | Rank | Female Poverty Among 18-24 Year Olds |
| Immigrants | Senegal | 0.0 /100 | #290 | Tragic 22.4% |
| Bangladeshis | 0.0 /100 | #291 | Tragic 22.5% |
| Alaskan Athabascans | 0.0 /100 | #292 | Tragic 22.5% |
| U.S. Virgin Islanders | 0.0 /100 | #293 | Tragic 22.5% |
| Indonesians | 0.0 /100 | #294 | Tragic 22.5% |
| Shoshone | 0.0 /100 | #295 | Tragic 22.5% |
| Menominee | 0.0 /100 | #296 | Tragic 22.5% |
| Inupiat | 0.0 /100 | #297 | Tragic 22.6% |
| Central American Indians | 0.0 /100 | #298 | Tragic 22.6% |
| Cherokee | 0.0 /100 | #299 | Tragic 22.7% |
| Africans | 0.0 /100 | #300 | Tragic 22.8% |
| Seminole | 0.0 /100 | #301 | Tragic 22.9% |
| Iroquois | 0.0 /100 | #302 | Tragic 22.9% |
| Senegalese | 0.0 /100 | #303 | Tragic 23.0% |
| Sudanese | 0.0 /100 | #304 | Tragic 23.0% |
Demographics Similar to Immigrants from Israel by Female Poverty Among 18-24 Year Olds
In terms of female poverty among 18-24 year olds, the demographic groups most similar to Immigrants from Israel are Nigerian (20.4%, a difference of 0.070%), Mexican American Indian (20.4%, a difference of 0.080%), Moroccan (20.4%, a difference of 0.090%), Immigrants from Latvia (20.4%, a difference of 0.10%), and Czech (20.4%, a difference of 0.14%).
| Demographics | Rating | Rank | Female Poverty Among 18-24 Year Olds |
| Nepalese | 39.7 /100 | #185 | Fair 20.2% |
| Immigrants | Ethiopia | 37.3 /100 | #186 | Fair 20.2% |
| Immigrants | Mexico | 36.3 /100 | #187 | Fair 20.2% |
| Scandinavians | 34.6 /100 | #188 | Fair 20.3% |
| Immigrants | Germany | 34.0 /100 | #189 | Fair 20.3% |
| Immigrants | Western Asia | 29.3 /100 | #190 | Fair 20.3% |
| Moroccans | 25.8 /100 | #191 | Fair 20.4% |
| Immigrants | Israel | 24.4 /100 | #192 | Fair 20.4% |
| Nigerians | 23.4 /100 | #193 | Fair 20.4% |
| Mexican American Indians | 23.2 /100 | #194 | Fair 20.4% |
| Immigrants | Latvia | 23.0 /100 | #195 | Fair 20.4% |
| Czechs | 22.3 /100 | #196 | Fair 20.4% |
| Zimbabweans | 21.0 /100 | #197 | Fair 20.4% |
| Immigrants | Spain | 20.7 /100 | #198 | Fair 20.4% |
| Germans | 20.6 /100 | #199 | Fair 20.4% |