Bahamian vs Northern European Female Poverty Among 18-24 Year Olds
COMPARE
Bahamian
Northern European
Female Poverty Among 18-24 Year Olds
Female Poverty Among 18-24 Year Olds Comparison
Bahamians
Northern Europeans
21.8%
FEMALE POVERTY AMONG 18-24 YEAR OLDS
0.1/ 100
METRIC RATING
276th/ 347
METRIC RANK
20.6%
FEMALE POVERTY AMONG 18-24 YEAR OLDS
11.6/ 100
METRIC RATING
213th/ 347
METRIC RANK
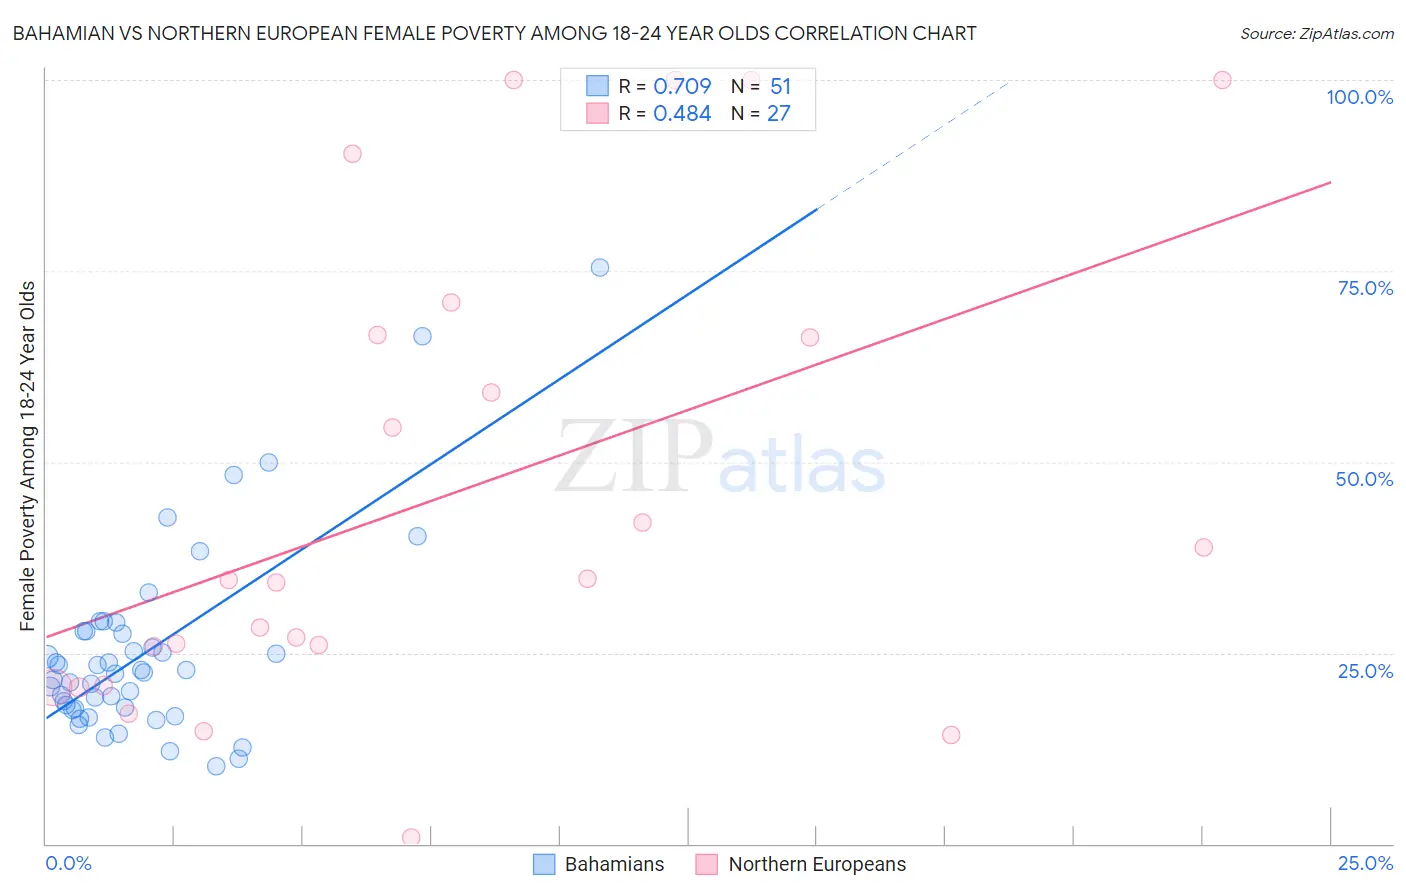
Bahamian vs Northern European Female Poverty Among 18-24 Year Olds Correlation Chart
The statistical analysis conducted on geographies consisting of 111,859,293 people shows a strong positive correlation between the proportion of Bahamians and poverty level among females between the ages 18 and 24 in the United States with a correlation coefficient (R) of 0.709 and weighted average of 21.8%. Similarly, the statistical analysis conducted on geographies consisting of 393,501,500 people shows a moderate positive correlation between the proportion of Northern Europeans and poverty level among females between the ages 18 and 24 in the United States with a correlation coefficient (R) of 0.484 and weighted average of 20.6%, a difference of 5.8%.
Female Poverty Among 18-24 Year Olds Correlation Summary
| Measurement | Bahamian | Northern European |
| Minimum | 10.1% | 0.88% |
| Maximum | 75.5% | 100.0% |
| Range | 65.4% | 99.1% |
| Mean | 25.1% | 45.7% |
| Median | 22.5% | 34.6% |
| Interquartile 25% (IQ1) | 17.7% | 20.7% |
| Interquartile 75% (IQ3) | 27.8% | 66.7% |
| Interquartile Range (IQR) | 10.1% | 45.9% |
| Standard Deviation (Sample) | 12.7% | 30.7% |
| Standard Deviation (Population) | 12.6% | 30.1% |
Similar Demographics by Female Poverty Among 18-24 Year Olds
Demographics Similar to Bahamians by Female Poverty Among 18-24 Year Olds
In terms of female poverty among 18-24 year olds, the demographic groups most similar to Bahamians are Immigrants from Bangladesh (21.8%, a difference of 0.020%), Immigrants from Honduras (21.8%, a difference of 0.060%), Immigrants from Switzerland (21.8%, a difference of 0.13%), Yaqui (21.9%, a difference of 0.39%), and New Zealander (21.7%, a difference of 0.45%).
| Demographics | Rating | Rank | Female Poverty Among 18-24 Year Olds |
| Celtics | 0.2 /100 | #269 | Tragic 21.6% |
| Mongolians | 0.2 /100 | #270 | Tragic 21.6% |
| Scotch-Irish | 0.2 /100 | #271 | Tragic 21.6% |
| Basques | 0.2 /100 | #272 | Tragic 21.7% |
| New Zealanders | 0.2 /100 | #273 | Tragic 21.7% |
| Immigrants | Honduras | 0.1 /100 | #274 | Tragic 21.8% |
| Immigrants | Bangladesh | 0.1 /100 | #275 | Tragic 21.8% |
| Bahamians | 0.1 /100 | #276 | Tragic 21.8% |
| Immigrants | Switzerland | 0.1 /100 | #277 | Tragic 21.8% |
| Yaqui | 0.1 /100 | #278 | Tragic 21.9% |
| Spanish Americans | 0.1 /100 | #279 | Tragic 21.9% |
| Immigrants | Dominica | 0.1 /100 | #280 | Tragic 21.9% |
| Immigrants | Dominican Republic | 0.1 /100 | #281 | Tragic 21.9% |
| Bermudans | 0.1 /100 | #282 | Tragic 21.9% |
| Sub-Saharan Africans | 0.0 /100 | #283 | Tragic 22.0% |
Demographics Similar to Northern Europeans by Female Poverty Among 18-24 Year Olds
In terms of female poverty among 18-24 year olds, the demographic groups most similar to Northern Europeans are Liberian (20.6%, a difference of 0.010%), Immigrants from South Africa (20.6%, a difference of 0.11%), Spanish (20.6%, a difference of 0.15%), Immigrants from Western Africa (20.6%, a difference of 0.17%), and Immigrants from Western Europe (20.6%, a difference of 0.21%).
| Demographics | Rating | Rank | Female Poverty Among 18-24 Year Olds |
| Hispanics or Latinos | 16.6 /100 | #206 | Poor 20.5% |
| Spaniards | 16.3 /100 | #207 | Poor 20.5% |
| Dutch | 15.9 /100 | #208 | Poor 20.5% |
| Arabs | 15.5 /100 | #209 | Poor 20.5% |
| Immigrants | Ghana | 14.3 /100 | #210 | Poor 20.5% |
| Immigrants | Western Europe | 13.5 /100 | #211 | Poor 20.6% |
| Liberians | 11.6 /100 | #212 | Poor 20.6% |
| Northern Europeans | 11.6 /100 | #213 | Poor 20.6% |
| Immigrants | South Africa | 10.7 /100 | #214 | Poor 20.6% |
| Spanish | 10.4 /100 | #215 | Poor 20.6% |
| Immigrants | Western Africa | 10.2 /100 | #216 | Poor 20.6% |
| Immigrants | Laos | 9.7 /100 | #217 | Tragic 20.6% |
| Immigrants | Nepal | 9.6 /100 | #218 | Tragic 20.7% |
| Immigrants | Micronesia | 9.6 /100 | #219 | Tragic 20.7% |
| British | 9.4 /100 | #220 | Tragic 20.7% |