Afghan vs Northern European Female Poverty Among 18-24 Year Olds

COMPARE

Afghan
Race
Ancestry
AfghanAfricanAlaska NativeAlaskan AthabascanAlbanianAleutAlsatianAmericanApacheArabArapahoArgentineanArmenianAssyrian/Chaldean/SyriacAustralianAustrianBahamianBangladeshiBarbadianBasqueBelgianBelizeanBermudanBhutaneseBlackfeetBolivianBrazilianBritishBritish West IndianBulgarianBurmeseCajunCambodianCanadianCape VerdeanCarpatho RusynCelticCentral AmericanCentral American IndianCherokeeCheyenneChickasawChileanChineseChippewaChoctawColombianColvilleComancheCosta RicanCreeCreekCroatianCrowCubanCypriotCzechCzechoslovakianDanishDelawareDominicanDutchDutch West IndianEastern EuropeanEcuadorianEgyptianEnglishEstonianEthiopianEuropeanFijianFilipinoFinnishFrenchFrench American IndianFrench CanadianGermanGerman RussianGhanaianGreekGuamanian/ChamorroGuatemalanGuyaneseHaitianHmongHonduranHopiHoumaHungarianIcelanderIndian (Asian)IndonesianInupiatIranianIraqiIrishIroquoisIsraeliItalianJamaicanJapaneseJordanianKenyanKiowaKoreanLaotianLatvianLebaneseLiberianLithuanianLumbeeLuxembourgerMacedonianMalaysianMalteseMarshalleseMenomineeMexicanMexican American IndianMongolianMoroccanNative HawaiianNavajoNepaleseNew ZealanderNicaraguanNigerianNorwegianOkinawanOsageOttawaPaiutePakistaniPalestinianPanamanianParaguayanPennsylvania GermanPeruvianPimaPolishPortuguesePotawatomiPuebloPuerto RicanPuget Sound SalishRomanianRussianSalvadoranSamoanScandinavianScotch-IrishScottishSeminoleSenegaleseSerbianShoshoneSierra LeoneanSiouxSlavicSlovakSloveneSomaliSouth AfricanSouth AmericanSouth American IndianSoviet UnionSpaniardSpanishSpanish AmericanSpanish American IndianSri LankanSubsaharan AfricanSudaneseSwedishSwissSyrianTaiwaneseThaiTlingit-HaidaTohono O'OdhamTonganTrinidadian and TobagonianTsimshianTurkishU.S. Virgin IslanderUgandanUkrainianUruguayanUteVenezuelanVietnameseWelshWest IndianYakamaYaquiYugoslavianYumanYup'ikZimbabwean
Immigration
NonimmigrantsImmigrantsAfghanistanAfricaAlbaniaArgentinaArmeniaAsiaAustraliaAustriaBahamasBangladeshBarbadosBelarusBelgiumBelizeBoliviaBosnia and HerzegovinaBrazilBulgariaBurma/MyanmarCabo VerdeCambodiaCameroonCanadaCaribbeanCentral AmericaChileChinaColombiaCongoCosta RicaCroatiaCubaCzechoslovakiaDenmarkDominicaDominican RepublicEastern AfricaEastern AsiaEastern EuropeEcuadorEgyptEl SalvadorEnglandEritreaEthiopiaEuropeFijiFranceGermanyGhanaGreeceGrenadaGuatemalaGuyanaHaitiHondurasHong KongHungaryIndiaIndonesiaIranIraqIrelandIsraelItalyJamaicaJapanJordanKazakhstanKenyaKoreaKuwaitLaosLatin AmericaLatviaLebanonLiberiaLithuaniaMalaysiaMexicoMicronesiaMiddle AfricaMoldovaMoroccoNepalNetherlandsNicaraguaNigeriaNorth AmericaNorth MacedoniaNorthern AfricaNorthern EuropeNorwayOceaniaPakistanPanamaPeruPhilippinesPolandPortugalRomaniaRussiaSaudi ArabiaScotlandSenegalSerbiaSierra LeoneSingaporeSomaliaSouth AfricaSouth AmericaSouth Central AsiaSouth Eastern AsiaSouthern EuropeSpainSri LankaSt. Vincent and the GrenadinesSudanSwedenSwitzerlandSyriaTaiwanThailandTrinidad and TobagoTurkeyUgandaUkraineUruguayUzbekistanVenezuelaVietnamWest IndiesWestern AfricaWestern AsiaWestern EuropeYemenZaireZimbabweAzores
Northern European
Race
Ancestry
AfricanAlaska NativeAlaskan AthabascanAlbanianAleutAlsatianAmericanApacheArabArapahoArgentineanArmenianAssyrian/Chaldean/SyriacAustralianAustrianBahamianBangladeshiBarbadianBasqueBelgianBelizeanBermudanBhutaneseBlackfeetBolivianBrazilianBritishBritish West IndianBulgarianBurmeseCajunCambodianCanadianCape VerdeanCarpatho RusynCelticCentral AmericanCentral American IndianCherokeeCheyenneChickasawChileanChineseChippewaChoctawColombianColvilleComancheCosta RicanCreeCreekCroatianCrowCubanCypriotCzechCzechoslovakianDanishDelawareDominicanDutchDutch West IndianEastern EuropeanEcuadorianEgyptianEnglishEstonianEthiopianEuropeanFijianFilipinoFinnishFrenchFrench American IndianFrench CanadianGermanGerman RussianGhanaianGreekGuamanian/ChamorroGuatemalanGuyaneseHaitianHmongHonduranHopiHoumaHungarianIcelanderIndian (Asian)IndonesianInupiatIranianIraqiIrishIroquoisIsraeliItalianJamaicanJapaneseJordanianKenyanKiowaKoreanLaotianLatvianLebaneseLiberianLithuanianLumbeeLuxembourgerMacedonianMalaysianMalteseMarshalleseMenomineeMexicanMexican American IndianMongolianMoroccanNative HawaiianNavajoNepaleseNew ZealanderNicaraguanNigerianNorthern EuropeanNorwegianOkinawanOsageOttawaPaiutePakistaniPalestinianPanamanianParaguayanPennsylvania GermanPeruvianPimaPolishPortuguesePotawatomiPuebloPuerto RicanPuget Sound SalishRomanianRussianSalvadoranSamoanScandinavianScotch-IrishScottishSeminoleSenegaleseSerbianShoshoneSierra LeoneanSiouxSlavicSlovakSloveneSomaliSouth AfricanSouth AmericanSouth American IndianSoviet UnionSpaniardSpanishSpanish AmericanSpanish American IndianSri LankanSubsaharan AfricanSudaneseSwedishSwissSyrianTaiwaneseThaiTlingit-HaidaTohono O'OdhamTonganTrinidadian and TobagonianTsimshianTurkishU.S. Virgin IslanderUgandanUkrainianUruguayanUteVenezuelanVietnameseWelshWest IndianYakamaYaquiYugoslavianYumanYup'ikZimbabwean
Immigration
NonimmigrantsImmigrantsAfghanistanAfricaAlbaniaArgentinaArmeniaAsiaAustraliaAustriaBahamasBangladeshBarbadosBelarusBelgiumBelizeBoliviaBosnia and HerzegovinaBrazilBulgariaBurma/MyanmarCabo VerdeCambodiaCameroonCanadaCaribbeanCentral AmericaChileChinaColombiaCongoCosta RicaCroatiaCubaCzechoslovakiaDenmarkDominicaDominican RepublicEastern AfricaEastern AsiaEastern EuropeEcuadorEgyptEl SalvadorEnglandEritreaEthiopiaEuropeFijiFranceGermanyGhanaGreeceGrenadaGuatemalaGuyanaHaitiHondurasHong KongHungaryIndiaIndonesiaIranIraqIrelandIsraelItalyJamaicaJapanJordanKazakhstanKenyaKoreaKuwaitLaosLatin AmericaLatviaLebanonLiberiaLithuaniaMalaysiaMexicoMicronesiaMiddle AfricaMoldovaMoroccoNepalNetherlandsNicaraguaNigeriaNorth AmericaNorth MacedoniaNorthern AfricaNorthern EuropeNorwayOceaniaPakistanPanamaPeruPhilippinesPolandPortugalRomaniaRussiaSaudi ArabiaScotlandSenegalSerbiaSierra LeoneSingaporeSomaliaSouth AfricaSouth AmericaSouth Central AsiaSouth Eastern AsiaSouthern EuropeSpainSri LankaSt. Vincent and the GrenadinesSudanSwedenSwitzerlandSyriaTaiwanThailandTrinidad and TobagoTurkeyUgandaUkraineUruguayUzbekistanVenezuelaVietnamWest IndiesWestern AfricaWestern AsiaWestern EuropeYemenZaireZimbabweAzores
Female Poverty Among 18-24 Year Olds
Income
Poverty
Unemployment
Labor Participation
Family Structure
Vehicle Availability
Education Level
Disability

Female Poverty Among 18-24 Year Olds Comparison

Afghans

Northern Europeans

Exceptional
Poor
19.0%
FEMALE POVERTY AMONG 18-24 YEAR OLDS
99.0/ 100
METRIC RATING
90th/ 347
METRIC RANK
20.6%
FEMALE POVERTY AMONG 18-24 YEAR OLDS
11.6/ 100
METRIC RATING
213th/ 347
METRIC RANK

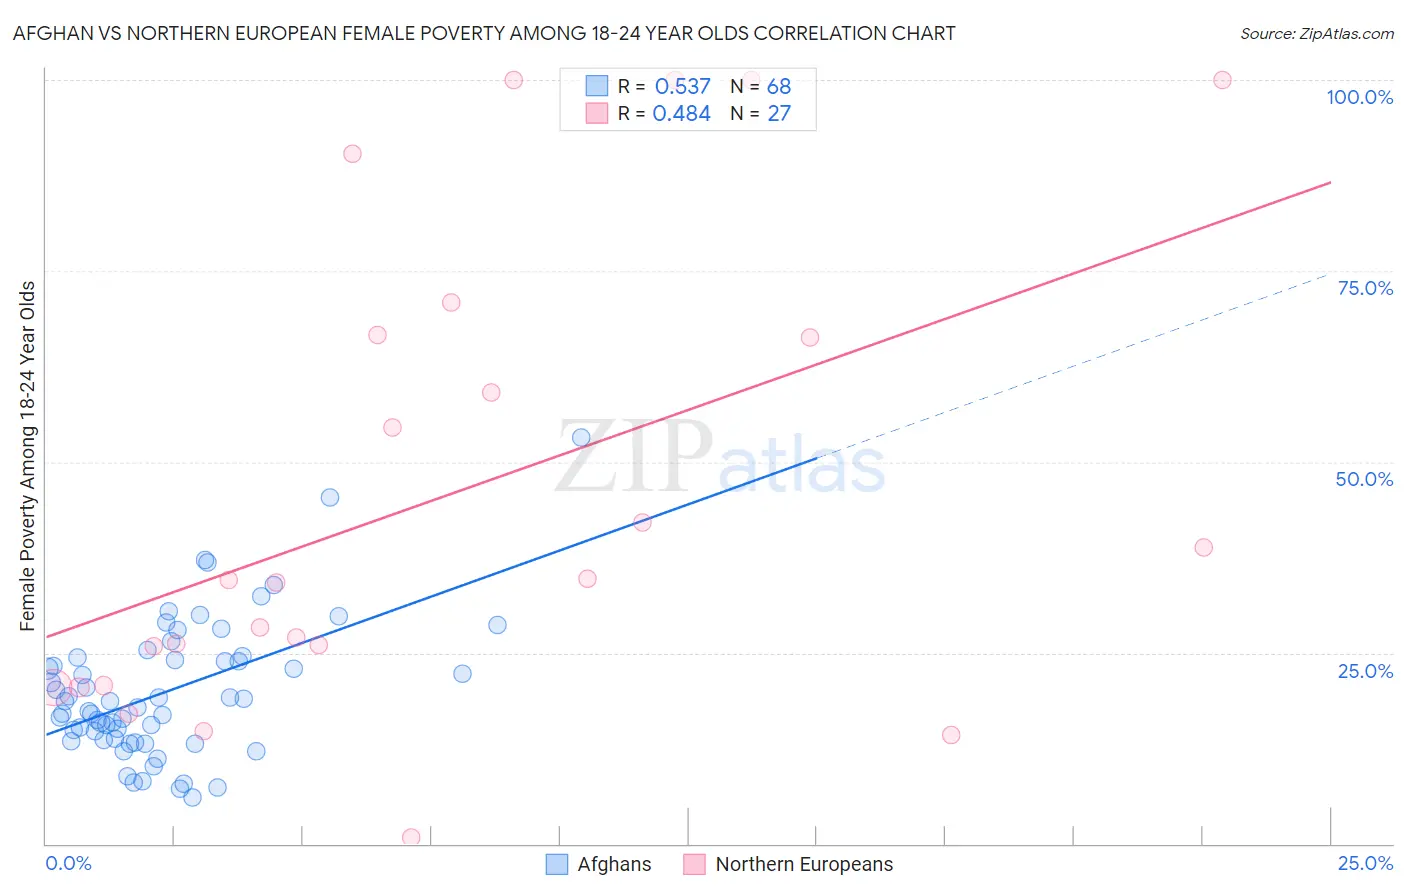
Afghan vs Northern European Female Poverty Among 18-24 Year Olds Correlation Chart

The statistical analysis conducted on geographies consisting of 147,837,560 people shows a substantial positive correlation between the proportion of Afghans and poverty level among females between the ages 18 and 24 in the United States with a correlation coefficient (R) of 0.537 and weighted average of 19.0%. Similarly, the statistical analysis conducted on geographies consisting of 393,501,500 people shows a moderate positive correlation between the proportion of Northern Europeans and poverty level among females between the ages 18 and 24 in the United States with a correlation coefficient (R) of 0.484 and weighted average of 20.6%, a difference of 8.6%.
Afghan vs Northern European Female Poverty Among 18-24 Year Olds

Female Poverty Among 18-24 Year Olds Correlation Summary

MeasurementAfghanNorthern European
Minimum6.1%0.88%
Maximum53.1%100.0%
Range47.0%99.1%
Mean19.9%45.7%
Median18.2%34.6%
Interquartile 25% (IQ1)13.6%20.7%
Interquartile 75% (IQ3)24.2%66.7%
Interquartile Range (IQR)10.5%45.9%
Standard Deviation (Sample)9.0%30.7%
Standard Deviation (Population)8.9%30.1%

Similar Demographics by Female Poverty Among 18-24 Year Olds

Demographics Similar to Afghans by Female Poverty Among 18-24 Year Olds

In terms of female poverty among 18-24 year olds, the demographic groups most similar to Afghans are Immigrants from Cabo Verde (19.0%, a difference of 0.030%), Croatian (19.0%, a difference of 0.050%), Romanian (19.0%, a difference of 0.090%), Filipino (19.0%, a difference of 0.14%), and Haitian (19.0%, a difference of 0.17%).
DemographicsRating | RankFemale Poverty Among 18-24 Year Olds
Immigrants | Indonesia
99.4
/100
|
#83
Exceptional
18.9%
Burmese
99.2
/100
|
#84
Exceptional
18.9%
Immigrants | Armenia
99.2
/100
|
#85
Exceptional
18.9%
Immigrants | Iraq
99.2
/100
|
#86
Exceptional
18.9%
Immigrants | Jamaica
99.2
/100
|
#87
Exceptional
18.9%
Croatians
99.1
/100
|
#88
Exceptional
19.0%
Immigrants | Cabo Verde
99.0
/100
|
#89
Exceptional
19.0%
Afghans
99.0
/100
|
#90
Exceptional
19.0%
Romanians
98.9
/100
|
#91
Exceptional
19.0%
Filipinos
98.9
/100
|
#92
Exceptional
19.0%
Haitians
98.9
/100
|
#93
Exceptional
19.0%
Ukrainians
98.8
/100
|
#94
Exceptional
19.0%
Guamanians/Chamorros
98.8
/100
|
#95
Exceptional
19.0%
Sierra Leoneans
98.7
/100
|
#96
Exceptional
19.0%
Salvadorans
98.4
/100
|
#97
Exceptional
19.1%

Demographics Similar to Northern Europeans by Female Poverty Among 18-24 Year Olds

In terms of female poverty among 18-24 year olds, the demographic groups most similar to Northern Europeans are Liberian (20.6%, a difference of 0.010%), Immigrants from South Africa (20.6%, a difference of 0.11%), Spanish (20.6%, a difference of 0.15%), Immigrants from Western Africa (20.6%, a difference of 0.17%), and Immigrants from Western Europe (20.6%, a difference of 0.21%).
DemographicsRating | RankFemale Poverty Among 18-24 Year Olds
Hispanics or Latinos
16.6
/100
|
#206
Poor
20.5%
Spaniards
16.3
/100
|
#207
Poor
20.5%
Dutch
15.9
/100
|
#208
Poor
20.5%
Arabs
15.5
/100
|
#209
Poor
20.5%
Immigrants | Ghana
14.3
/100
|
#210
Poor
20.5%
Immigrants | Western Europe
13.5
/100
|
#211
Poor
20.6%
Liberians
11.6
/100
|
#212
Poor
20.6%
Northern Europeans
11.6
/100
|
#213
Poor
20.6%
Immigrants | South Africa
10.7
/100
|
#214
Poor
20.6%
Spanish
10.4
/100
|
#215
Poor
20.6%
Immigrants | Western Africa
10.2
/100
|
#216
Poor
20.6%
Immigrants | Laos
9.7
/100
|
#217
Tragic
20.6%
Immigrants | Nepal
9.6
/100
|
#218
Tragic
20.7%
Immigrants | Micronesia
9.6
/100
|
#219
Tragic
20.7%
British
9.4
/100
|
#220
Tragic
20.7%